

ARM30 and Beyond: The Evolution of ARM Data
Published: 25 May 2023
Now in its fourth decade of collecting atmospheric data, ARM embraces adaptability to meet evolving user needs
This is the 10th and final article in the yearlong “ARM30” series of stories on the evolution of ARM―its data, sites, science missions, field campaigns, and people.
Over the past 30-plus years, the Atmospheric Radiation Measurement (ARM) user facility has collected vast and valuable data all over the world.
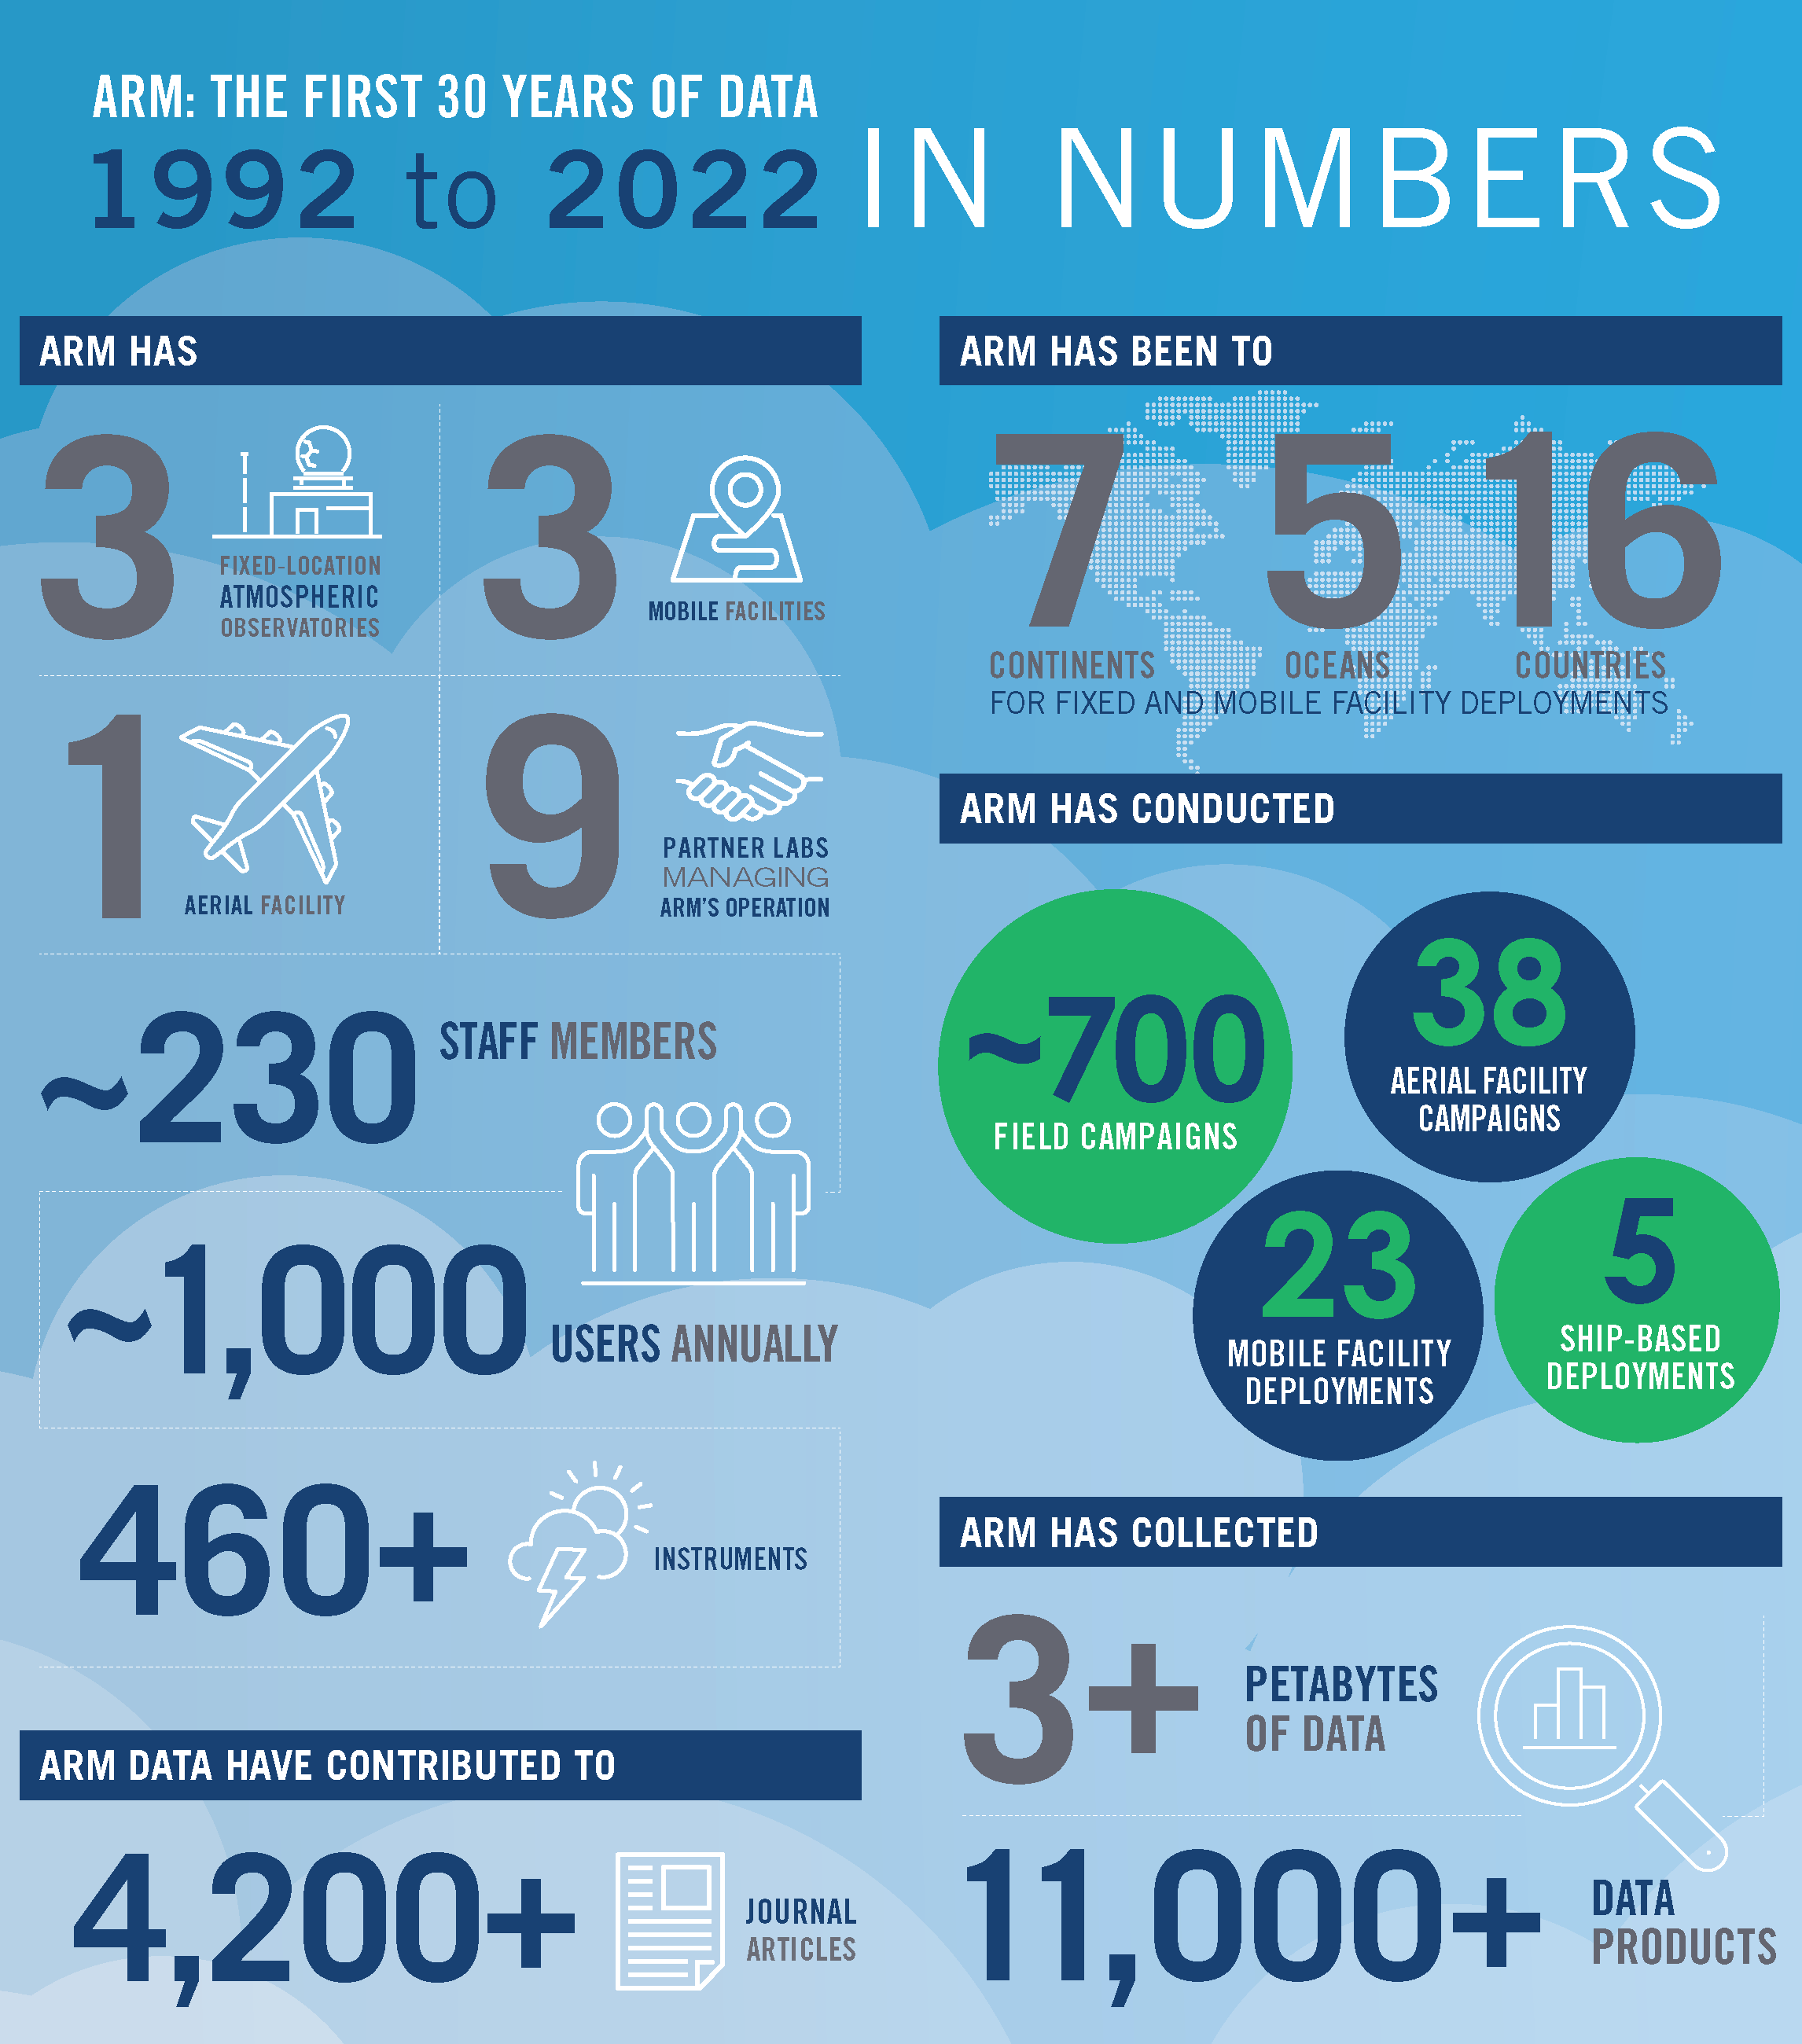
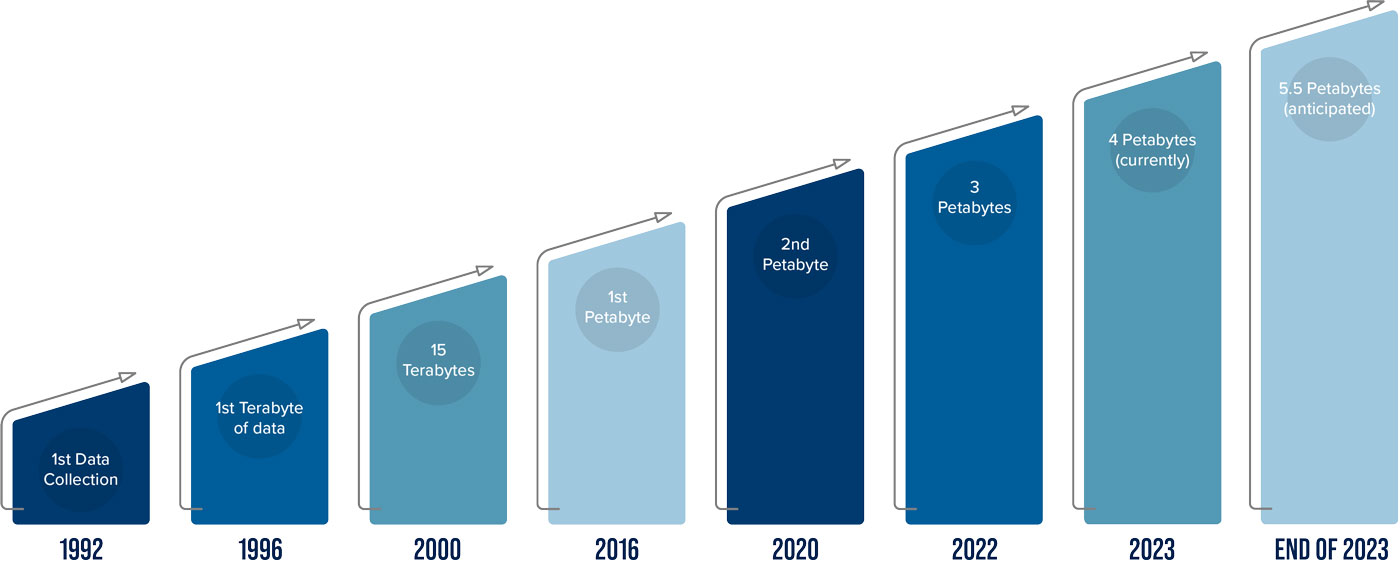
The ARM Data Center, based at Oak Ridge National Laboratory (ORNL) in Tennessee, hosts over 4 petabytes of data—the equivalent of 1 million DVDs’ worth. That is a large amount, to be sure, but it’s the data’s contents that are most meaningful to scientists who want to better understand the processes that drive Earth’s weather and climate.
ARM’s archive holds atmospheric measurements that cover all seven continents and five oceans. In remote and urban regions, more than 460 ARM instruments collect data on clouds, precipitation, solar and infrared energy, particles in the air, and other environmental elements.
All of that together produces a unique picture of how earth systems are changing—and, in some cases, how they might have looked in preindustrial times.
As technology and user needs have evolved, so have ARM’s approaches to collecting, processing, evaluating, storing, and distributing data. As a result, ARM is considered a standard-setter for providing atmospheric data to the scientific community.
In recognition of its data management efforts, the ARM Data Center in 2020 received a three-year certification from CoreTrustSeal, an international nonprofit that promotes sustainable and trustworthy data repositories.
The next year, the U.S. Department of Energy Office of Science (DOE-SC) designated the ARM Data Center as one of its Public Reusable Research (PuRe) Data Resources. According to the designation, PuRe resources “go above and beyond the standard SC requirements for data management plans and act as community leaders in data stewardship.”
ARM Director Jim Mather, who used ARM data as a postdoc at Pennsylvania State University, has had a front-row seat to the evolution of ARM data. The first two decades of this evolution are captured in the ARM monograph, which the American Meteorological Society published in 2016 as a chronicle of ARM’s first 20 years.
“ARM was and continues to be very unusual in the huge number of instruments and types of instruments we operate, and that was true even early on, so we really had to develop efficient ways of getting and processing these data,” says Mather. “The people that were doing this at the time were wise enough to realize we needed to have standards right out of the blocks in how we process these data, or we were going to get buried.”
The Birth and Early Years of ARM Data
In 1992, the internet as we know it was in its infancy. About 20% of U.S. households had personal computers. That year, ARM collected its first data in an Oklahoma farm field.
In 1996, ARM began operations on Manus Island, Papua New Guinea, the first site of what became the Tropical Western Pacific (TWP) observatory. A year later, ARM established an observatory on the North Slope of Alaska.
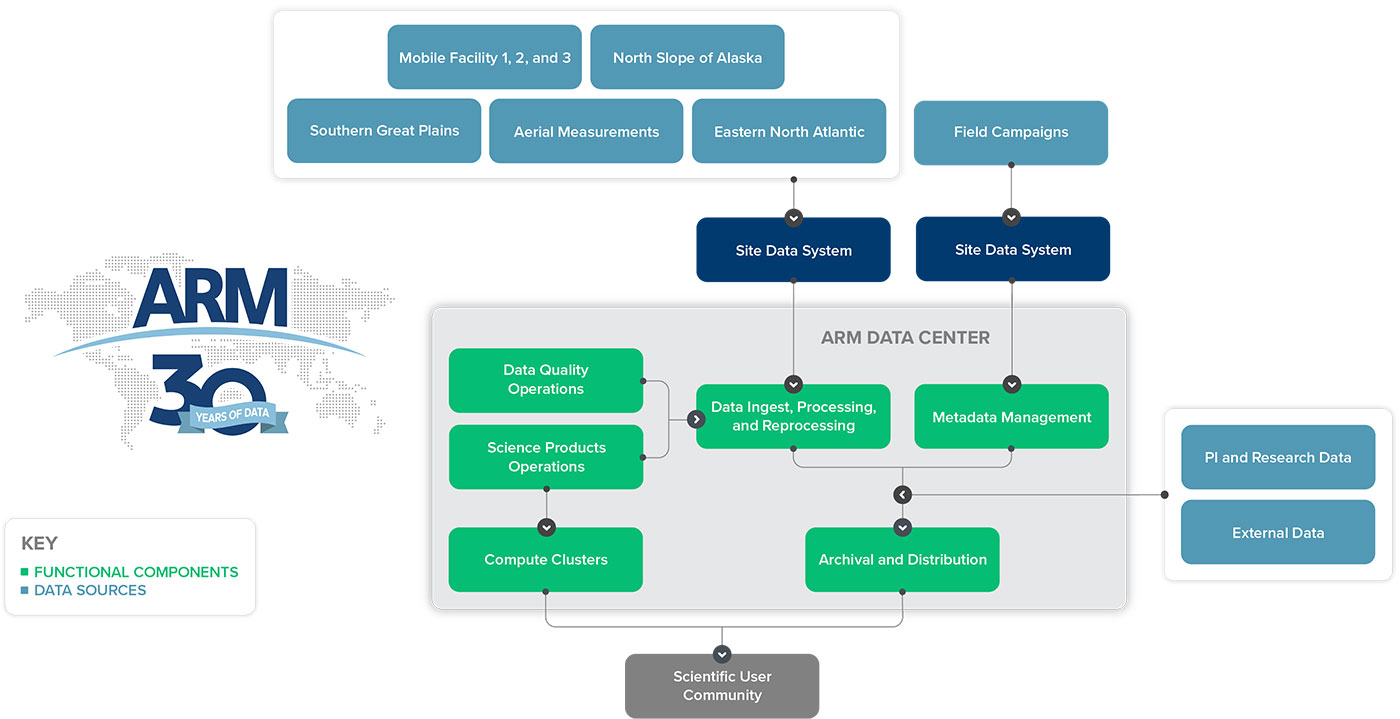
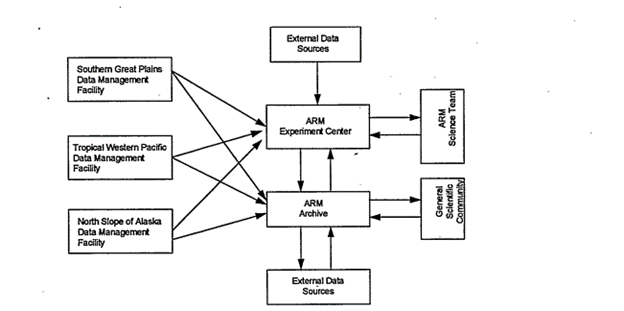
Each site had its own ways of collecting measurements, checking their quality, and creating data products, but all sites fed into the ARM Experiment Center, a predecessor of the ARM Data Center, for data processing.
Eventually, all data reached the ARM Data Archive for storage.
The original plan was for ARM to last 10 years, longer than similar programs, but that end date became less firm as time went on.
“We didn’t start the 10-year clock until the North Slope was going,” says Raymond McCord, who took over from Paul Singley in 1995 as the second ARM Data Archive manager and held that role for 21 years. “Of course, the interesting thing was by the time we actually considered we had started the clock, a lot of the people that were sponsoring us began to forget about the 10-year clock and began to realize that ARM should be as much as one can consider it forever.”
With a longer-term view in mind, an ARM Infrastructure Review Committee met in La Jolla, California, in 1999 to discuss ARM operations and how they could be more efficient.
In its summary report, the committee recommended common processes across ARM for developing site data systems, software, data quality review procedures, and data products. The Data Management Facility succeeded the ARM Experiment Center as a central venue for processing and software development. (In the late 2010s, the ARM Data Center became responsible for this work in addition to managing data storage and distribution.)
In 2004, ARM was designated as a DOE Office of Science national scientific user facility. As ARM moves closer to its 20th anniversary as a user facility in 2024, many of the recommendations implemented from the 1999 review still help ARM serve its users. Read more about the ARM Infrastructure Review.
The Evolution of Collecting Data
The first step in ARM’s data flow is the same now as it was in 1992: Collect the data.
Setting up instruments in the field to draw in data is one part of the process. Getting the data from the instruments to the archive is another.
At its largest, ARM’s first atmospheric observatory, the Southern Great Plains (SGP), covered 55,000 square miles of Oklahoma and Kansas. Before T1 telephone lines, satellite technology, and today’s high-speed internet, the “sneakernet” was the primary means of delivering data from smaller instrumented SGP sites to the Central Facility near Lamont, Oklahoma. People walked or drove the data to the Central Facility so they could be sent out for processing and storage.
TWP site scientists also took advantage of the sneakernet, though it was much slower than the SGP’s. Mather recalls a lag of three to six months in shipping back raw data.
In the meantime, the TWP sent compressed data stateside via low-bandwidth satellite channels. “That was all the real-time information we had to know if the site was working for a number of years,” says Mather.
The 1999 ARM Infrastructure Review led to the standardization of site data systems across ARM. This became important with the addition of three ARM Mobile Facilities from 2005 to 2013 and the start of the Eastern North Atlantic observatory in the Azores, an island chain west of mainland Portugal, in 2013.
Instruments are connected to a central computer, which collects the data and sends it to the ARM Data Center for processing, archiving, and delivery.
Data are typically made available to users 24 to 48 hours after collection.
“You’ve got your instruments in the field, and you need systems to communicate with those instruments to pull the data off. We’re responsible for making sure that those systems are online,” said Cory Stuart, the manager of ARM’s site data systems, in a 2019 ORNL article. “I’ve heard people say we’ve got a data center in a can.”
Nowadays, the internet is generally reliable for transmitting measurements to the ARM Data Center, but there are times when the sneakernet is still handy.
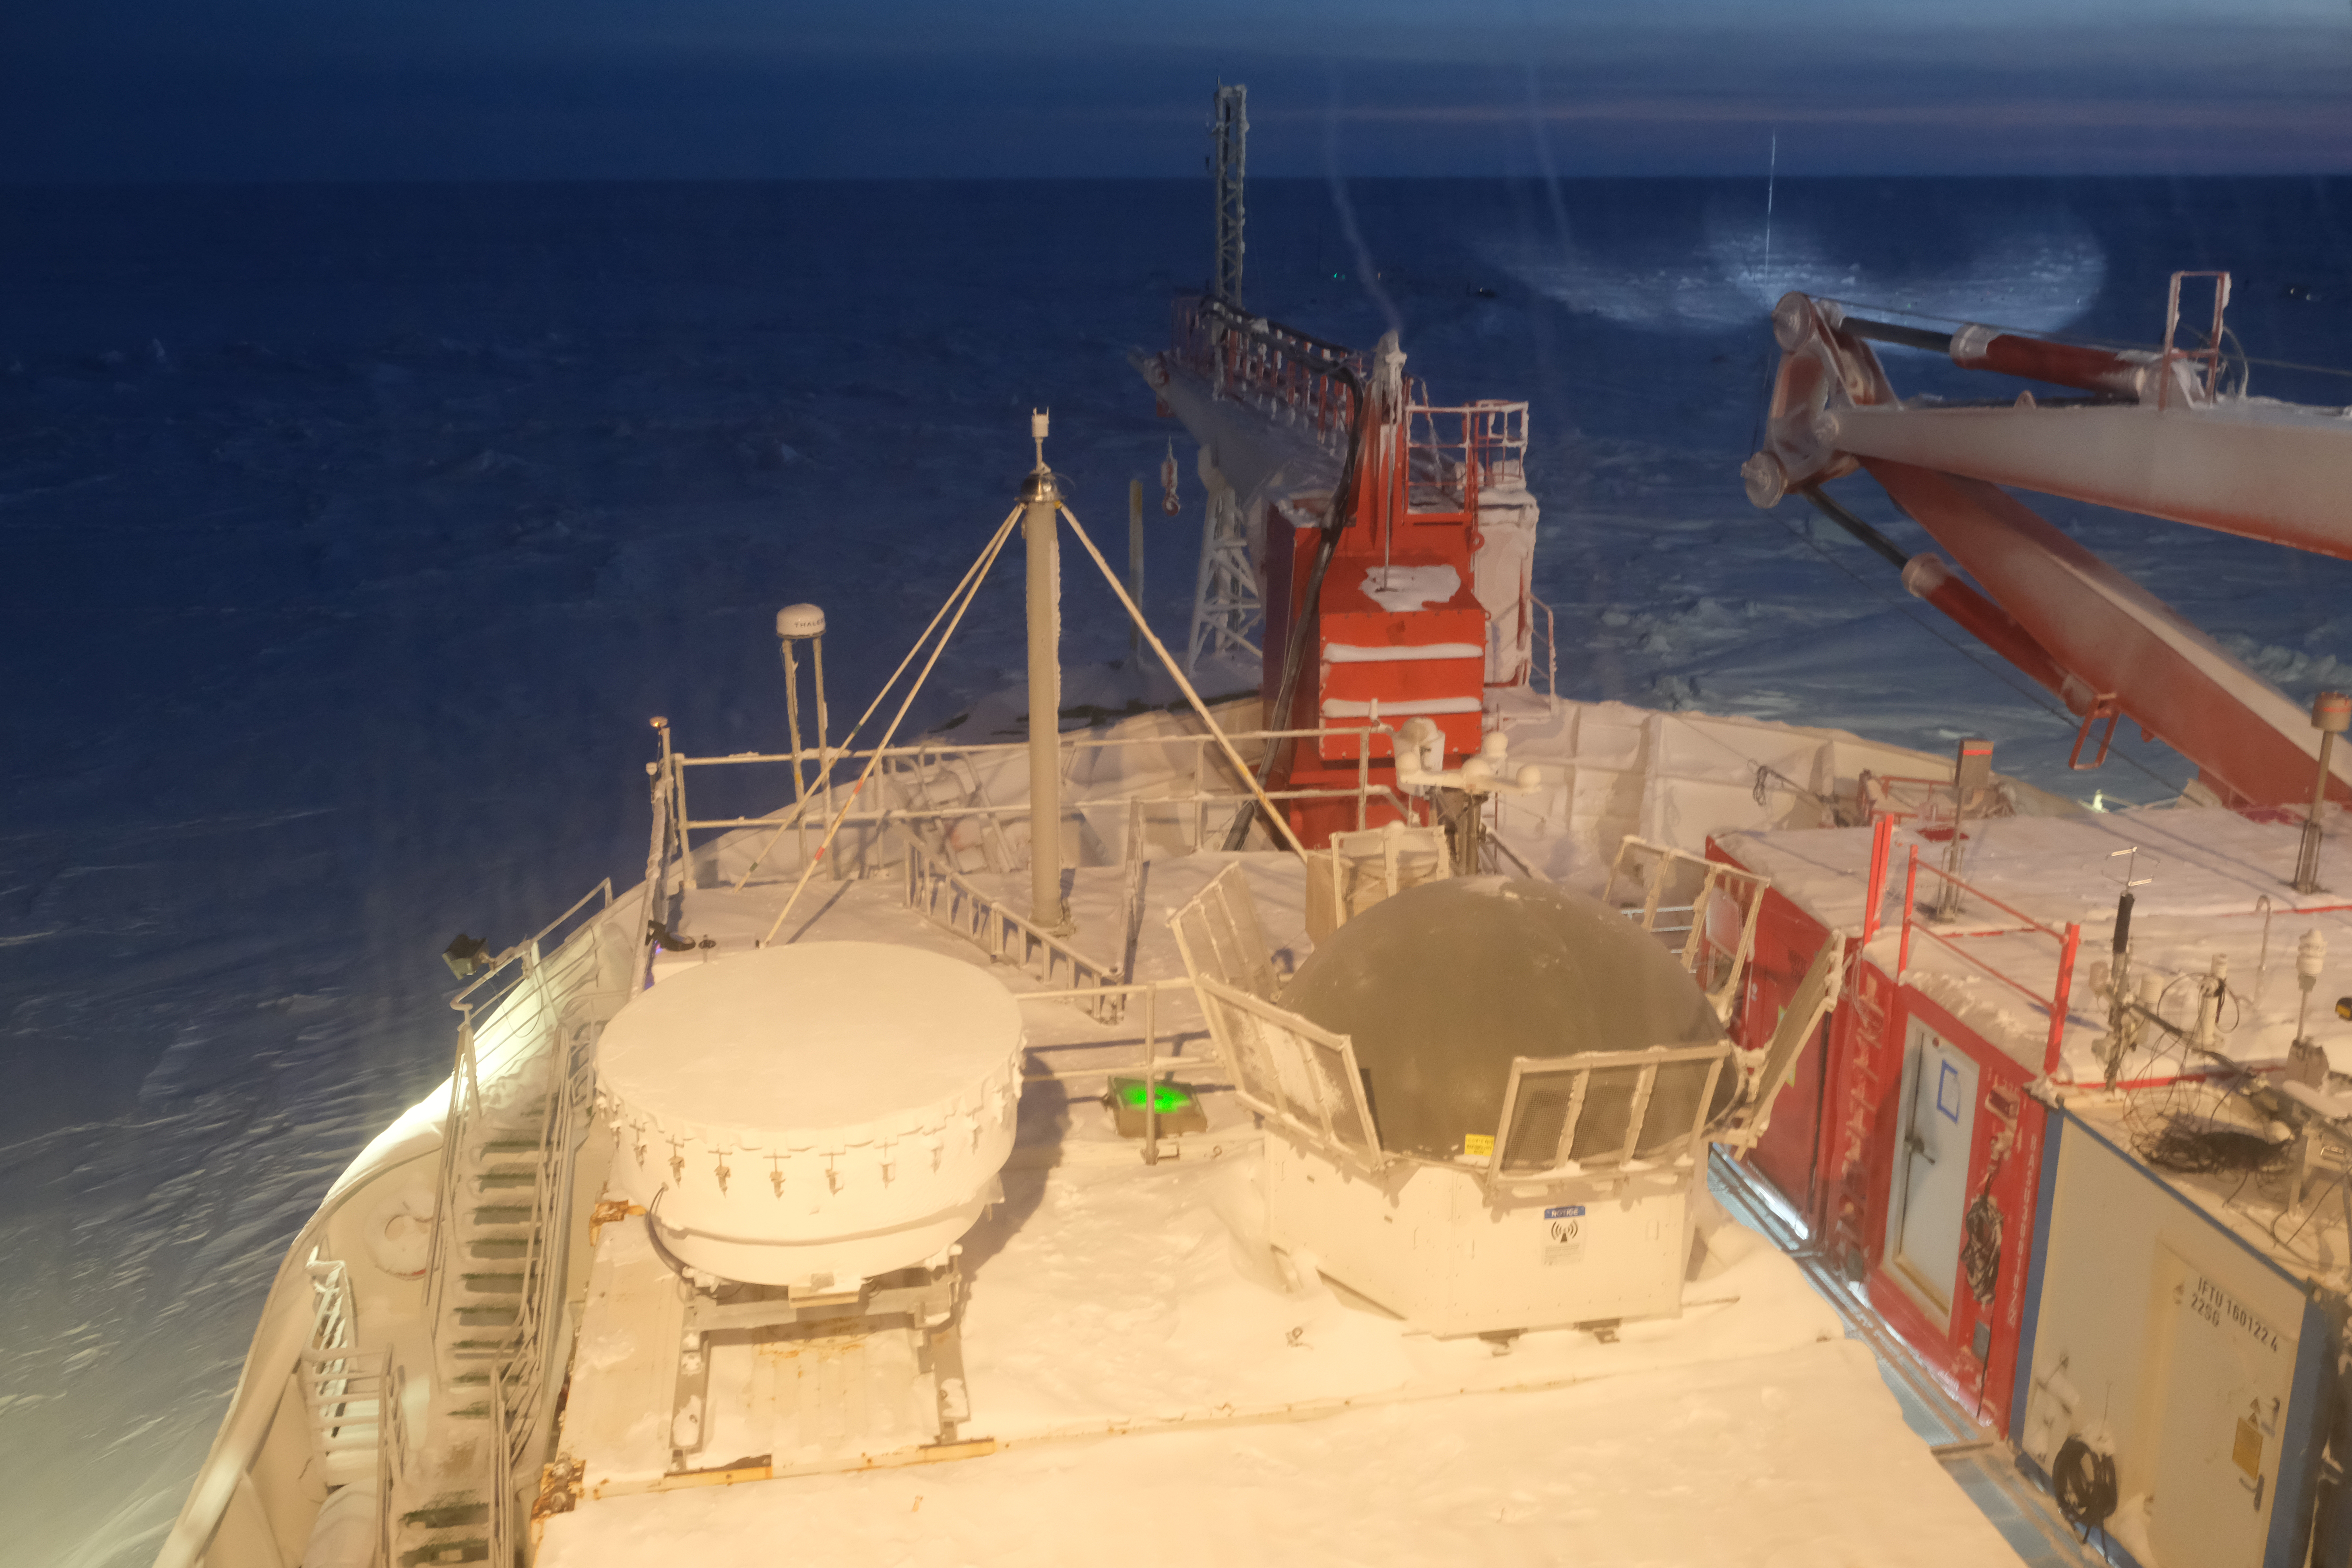
In 2019 and 2020, more than 50 ARM instruments operated in the central Arctic during the Multidisciplinary Drifting Observatory for the Study of Arctic Climate (MOSAiC) expedition. An ORNL engineer who set up ARM’s site data system for the expedition hand-carried hard drives full of MOSAiC data to the ARM Data Center.
The Evolution of Processing Data

Processing ARM data involves converting raw instrument data into a more usable format, creating data products for the scientific community, and reprocessing data that need to be corrected or restructured. These “ingests” are the first step in the processing workflow. Software developers at Pacific Northwest National Laboratory (PNNL) in Washington state routinely update more than 60 ingests to prepare for ARM mobile deployments.
From the beginning, network Common Data Form (netCDF) has been the preferred format for ARM data so scientists can access and use the files on different operating systems. Also, netCDF files can store information about the data in addition to the measurements themselves.
ARM has more than 11,000 data products, including those from field campaigns, principal investigators, and external organizations.
Value-added products (VAPs) combine measurements from multiple instruments to create new datastreams that are more usable and meaningful. VAPs typically compute geophysical variables that instruments do not measure directly, such as liquid water path. Some VAPs are “best estimate” products or packaged for modelers.
Science translators—another result of the 1999 ARM Infrastructure Review—are scientists who work with software developers to create VAPs, often based on feedback from users about their data needs. Translators and VAP developers are spread out across four DOE national laboratories.
Some VAPs are based on research products initially developed by ARM users and made operational by adding quality control checks and standardizing output.
Developing and reproducing a VAP is no small feat. Mather remembers a map of the Broadband Heating Rate Profile (BBHRP) VAP and all its required inputs.
“It was just an obscene number—there were like 20 different direct inputs, and then each one of those might have other inputs, and there might have been on the order of 50 data products that fed into BBHRP,” recalls Mather. “And so, making that all work—and then be able to do it again—20 years ago was a challenge.”
To help streamline ingest and VAP development, PNNL led the development of the ARM Data Integrator (ADI), an open-source framework that makes it much easier to process raw instrument data and combine diverse data sets into higher-order products.
During reprocessing, updated algorithms are often applied to correct and improve data across sites. Reprocessing has benefited from standardized procedures and task records. In the early days, ARM staff reprocessed data on the system where they were originally processed.
As data have become more complex, ARM has turned to high-performance computing for large-scale reprocessing tasks and other activities that require a lot of computing power and time. These activities include radar data processing, science data product creation, and data quality analysis.
The Evolution of Evaluating Data
“Two decades ago, ARM had the foresight not only to understand the importance of data quality, but the need to produce data in a coordinated way across the organization.”
ARM Data Quality Office Manager Randy Peppler, recognizing the 20th anniversary of the Data Quality Office in 2020
A guiding principle for ARM is providing continuous data of a “known and reasonable quality” to help scientists improve earth system models.
At the SGP in the 1990s, ARM implemented self-consistency checks for single datastreams and conducted quality measurement experiments to compare like data with a set of expected outcomes.
Across ARM, instrument mentors, site scientists, and site operators monitored and assessed data, but different ARM sites evaluated data quality and reported issues differently. Sometimes this resulted in inconsistent data, even from the same instrument at multiple sites.
The ARM Infrastructure Review Committee concluded that data quality procedures, like several other ARM processes, should be standardized and centralized.
July 2000 brought the establishment of the ARM Data Quality Office (DQO) at the University of Oklahoma.
Managed by geographer and atmospheric scientist Randy Peppler, the DQO reviews the quality of most data that flow into the ARM Data Center and communicates the results to the users.
The office currently consists of Peppler, four full-time staff, and a group of students working five to 20 hours per week.
A chapter of the 2016 monograph details the first 20 years of ARM’s data quality program, including the start of the DQO.
“Two decades ago, ARM had the foresight not only to understand the importance of data quality, but the need to produce data in a coordinated way across the organization,” said Peppler in 2020 as the DQO celebrated its 20th anniversary.
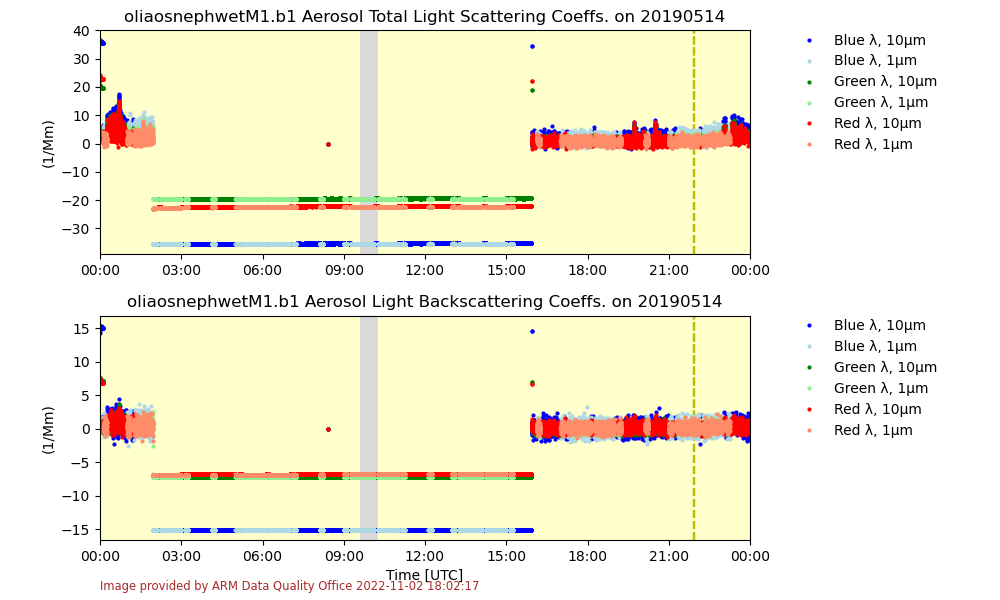
DQO Associate Manager Ken Kehoe estimates 5,000 plots are generated each day from measurements coming into the data center.
The DQO developed software tools that provide different views of the information shown in static plots. Users can pull up multiple plots at one time in DQ-Plotbrowser, plot data interactively in DQ-Zoom, and analyze data more closely in DQ-Explorer.
The office also contributed code to the Atmospheric data Community Toolkit (ACT), a Python-based library for working with atmospheric time-series data.
While DQO staff have thousands of plots they can sift through, some of the most valuable data quality information they receive comes from users and instrument mentors.
Another important way of uncovering data issues is through the production of VAPs. Processing multiple datastreams into VAPs sometimes reveals problems that went undetected in standard quality checks. Kehoe says this is “a fantastic tool” in particular for spotting anomalies in aerosol optical depth or radar data. It enables ARM staff to work backward and figure out where things went wrong.
The Evolution of Storing Data
ARM’s first data are stored on an optical tape at ORNL. The tape holds 1 terabyte of data—more than 200 DVDs’ worth—collected over ARM’s first four years.
Early on, ARM used magnetic tape, like the kind in a videocassette, as its primary data storage medium and backed up the files on optical tape. When users needed data, ARM copied them over to online disk for short-term access.
For more than 25 years, ARM has used high-performance storage systems (HPSS) that contain both tape and disk components. Data coming in are written to disk and then moved over to tape for deep, or long-term, storage.
McCord, who retired from ARM and ORNL in 2016, and ARM Data Services Manager Giri Prakash agree that ARM has consistently pushed the edge of HPSS capacity. On average, ARM is collecting and storing over 50 terabytes each month, says Prakash.
Plus, data have gotten much bigger since the 1990s. Some radars, for instance, can produce hundreds of gigabytes of data on their own.
ARM’s hardware must also keep up with the amount of data going to users. Prakash estimates that ARM sends out about 40 terabytes per month.
Needing more space and speed for handling data, ARM in 2023 plans to move away from its current HPSS to a new deep archival system called Themis. The Themis system boasts greater storage capacity and substantially faster data retrieval speeds than the current HPSS.
“I’ve always told people that storing data is easy—you just kind of copy it, there it is. Finding (data) is really difficult because you’ve got to have good descriptors.”
Retired ARM Data Archive Manager Raymond McCord
ARM operates hundreds more instruments than it did in 1992, including scanning radars and airborne instruments. Therefore, it is more important than ever to keep data organized for users.
“I’ve always told people that storing data is easy—you just kind of copy it, there it is,” says McCord. “Finding (data) is really difficult because you’ve got to have good descriptors. You’ve got to have some search logic that makes sense—and works. And you’ve got to be able to communicate to the user what it is they’ve found.”
Imagine ARM data being stored in a giant, searchable warehouse. Metadata are descriptions of the data, such as dates, site, or orientation of an instrument in the field. Thanks to these descriptions, people can quickly zero in on what they want instead of spending time in the back of the warehouse rummaging through boxes, drawers, and shelves.
Metadata management is an ongoing process for ARM. Kehoe says a user recently requested the location of an instrument down to submeter precision.
“We have the resources to give you what you need, even historical stuff,” says Kehoe, who led the development of an ARM data file standards document that discusses metadata.
As scientists ask for more information to conduct their research, ARM continues to open up more layers of metadata access to the users.
The Evolution of Distributing Data
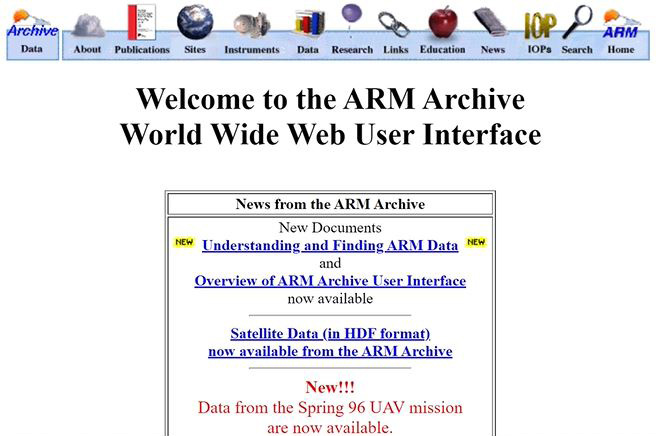
When researchers wanted ARM data in the early 1990s, they selected from a list of datastreams and date ranges. ARM would transfer files to the user’s system through FTP or ship them on disk. But the delivery process grew complicated with more sites, datastreams, and complex filenames. In addition, users wanted data that were more specific to their research needs.
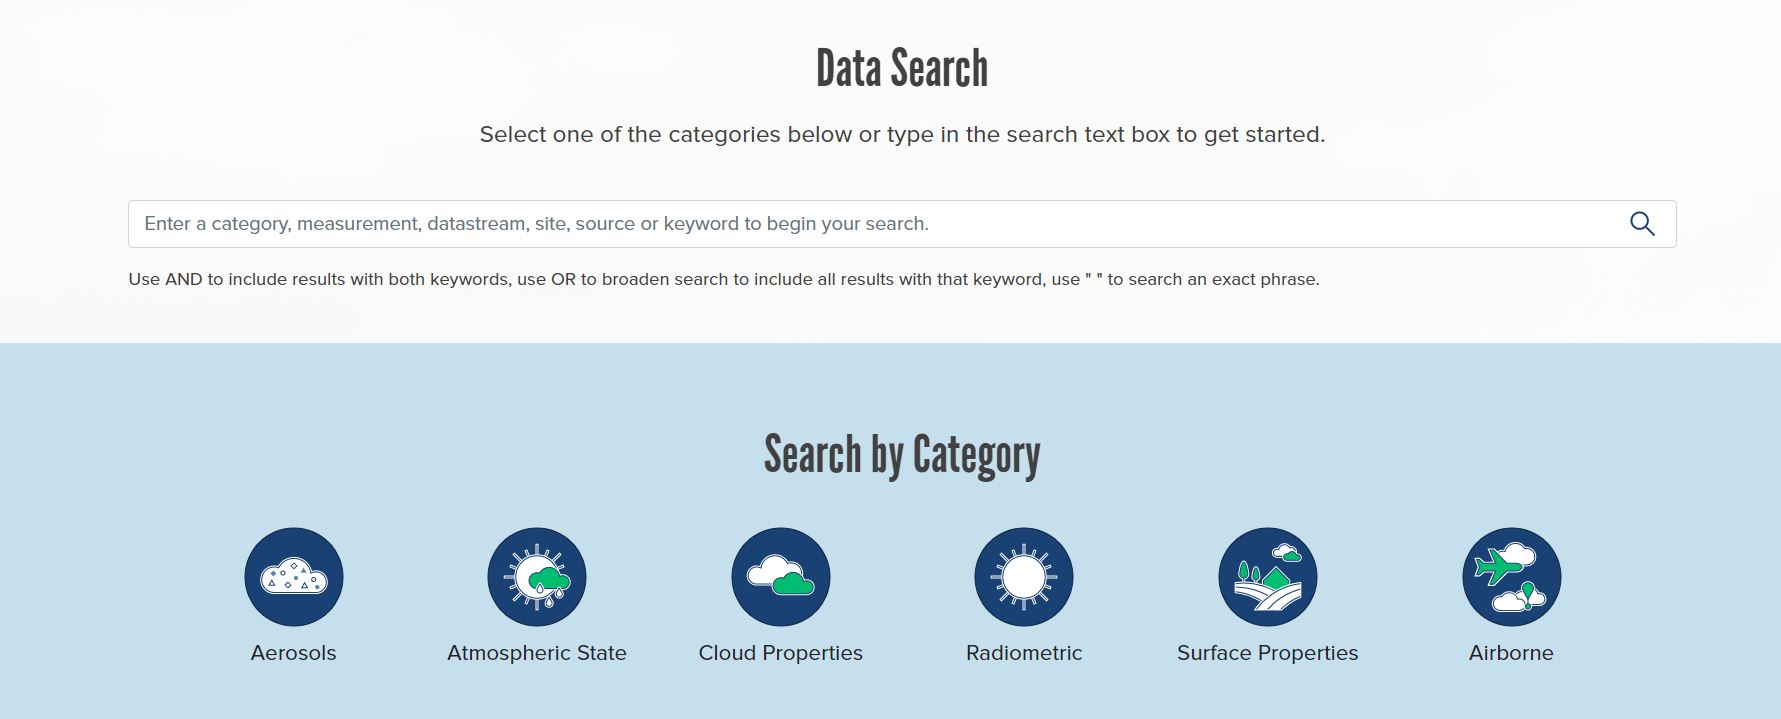
By 1995, developers had worked on ARM’s first web-based user interface. Eventually, that morphed into Data Discovery, which could be considered the customer service counter at the front of the ARM data warehouse. Users with an ARM data account can find and order data online through Data Discovery.
In May 2020, ARM officially launched a new version of Data Discovery to make searches smoother and to point users to recommended data products based on criteria such as data quality, accuracy, and completeness. The ARM Data Center continues to refine Data Discovery based on input from users and other stakeholders.
ARM also offers different ways for users to access data from its high-resolution modeling activity.
The Large-Eddy Simulation (LES) ARM Symbiotic Simulation and Observation (LASSO) activity first focused on producing shallow convection simulations and packaging them with SGP observations. Scientists can use the LASSO Bundle Browser to find the simulations they need.
Now the LASSO team is preparing for the full release of deep convection data from a 2018–2019 campaign in Argentina. LASSO deep convection simulations from the Cloud, Aerosol, and Complex Terrain Interactions (CACTI) campaign will add at least 2 more petabytes of data to ARM’s archive.
Currently, users can access data from the LASSO-CACTI beta release on ARM’s high-performance computing cluster. The LASSO team and ARM Data Center staff are working together to make the full release available in an updated version of the LASSO Bundle Browser.
The Evolution of Data Usage
“With three decades’ worth of data, powerful computing capabilities, and a wide range of open-source software, we are diligently establishing a comprehensive and cohesive data ecosystem that caters to the needs of our users.”
ARM Data Services Manager Giri Prakash
While 2023 might be the Year of Open Science across the federal government, ARM has always been a practitioner of open science.
Freely available ARM data have been used in more than 4,400 journal articles since 1992, providing new insights into atmospheric processes and improving their representation in models.
Now in its fourth decade, ARM remains focused on delivering quality observations to the scientific community while looking for opportunities to better enable data access and analysis as part of its latest Decadal Vision.
To that end, the ARM Data Center is developing a new ecosystem for interacting with ARM data. Known as the ARM Data Workbench, it will provide a set of tools for users to select data, retrieve measurement values, visualize and analyze data, and build their own data bundles.
Already, users can access JupyterHub from the workbench to create and share documents. JupyterHub comes installed with open-source software packages that make it easier to work with ARM data, such as ACT and the Python ARM Radar Toolkit (Py-ART).
“With three decades’ worth of data, powerful computing capabilities, and a wide range of open-source software, we are diligently establishing a comprehensive and cohesive data ecosystem that caters to the needs of our users,” says Prakash. “The future holds immense promise and excitement.”
ARM staff are exploring artificial intelligence and machine learning to improve operations and address components of the data life cycle, including discovery and analysis.
With ARM’s 31st anniversary of data collection on May 16, 2023, Mather sums up the work of everyone who has played a role in ARM data over the years: “ARM wouldn’t have survived without all the effort in this area.”
Thanks to that effort, ARM data will be accessible well into the future for users wanting to learn more about our planet.
Editor’s note (July 10, 2023): The DOE Office of Science published this article about the ARM Data Center as part of its Year of Open Science series on PuRe Data Resources.
Follow Us:


Keep up with the Atmospheric Observer
Updates on ARM news, events, and opportunities delivered to your inbox
ARM User Profile
ARM welcomes users from all institutions and nations. A free ARM user account is needed to access ARM data.


