

ARM Marks 30 Years of Collecting Atmospheric Data
Published: 16 May 2022
Starting in 1992, the user facility has pioneered continuous measurements of Earth’s fragile protective shell of gases and clouds
This is the first article in a yearlong series of stories on the evolution of ARM―its data, science missions, instruments, field campaigns, and people.
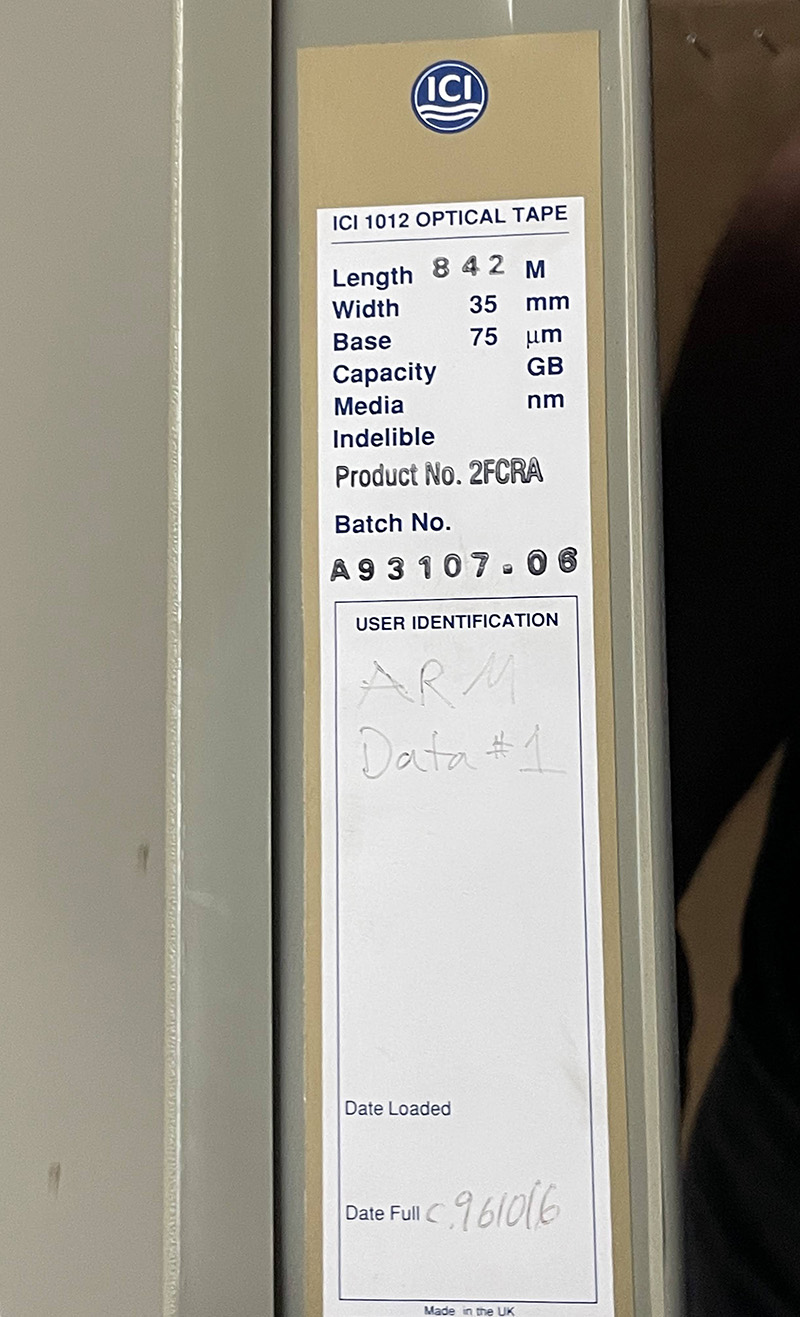
Tucked away at Oak Ridge National Laboratory in Tennessee is a beige plastic container of 35 mm optical tape. On one side, someone long ago scratched, “ARM Data #1.”
The container, about the size of a cutting board, has a half-mile of tape inside. It is the founding artifact of data collected by the Atmospheric Radiation Measurement (ARM) user facility.
In May 2022, ARM marks 30 years of collecting continuous measurements of the Earth’s atmosphere. So far, this U.S. Department of Energy (DOE) Office of Science user facility has archived over 3.3 petabytes of data—the amount that could fit on about 1,650 miles of optical tape.
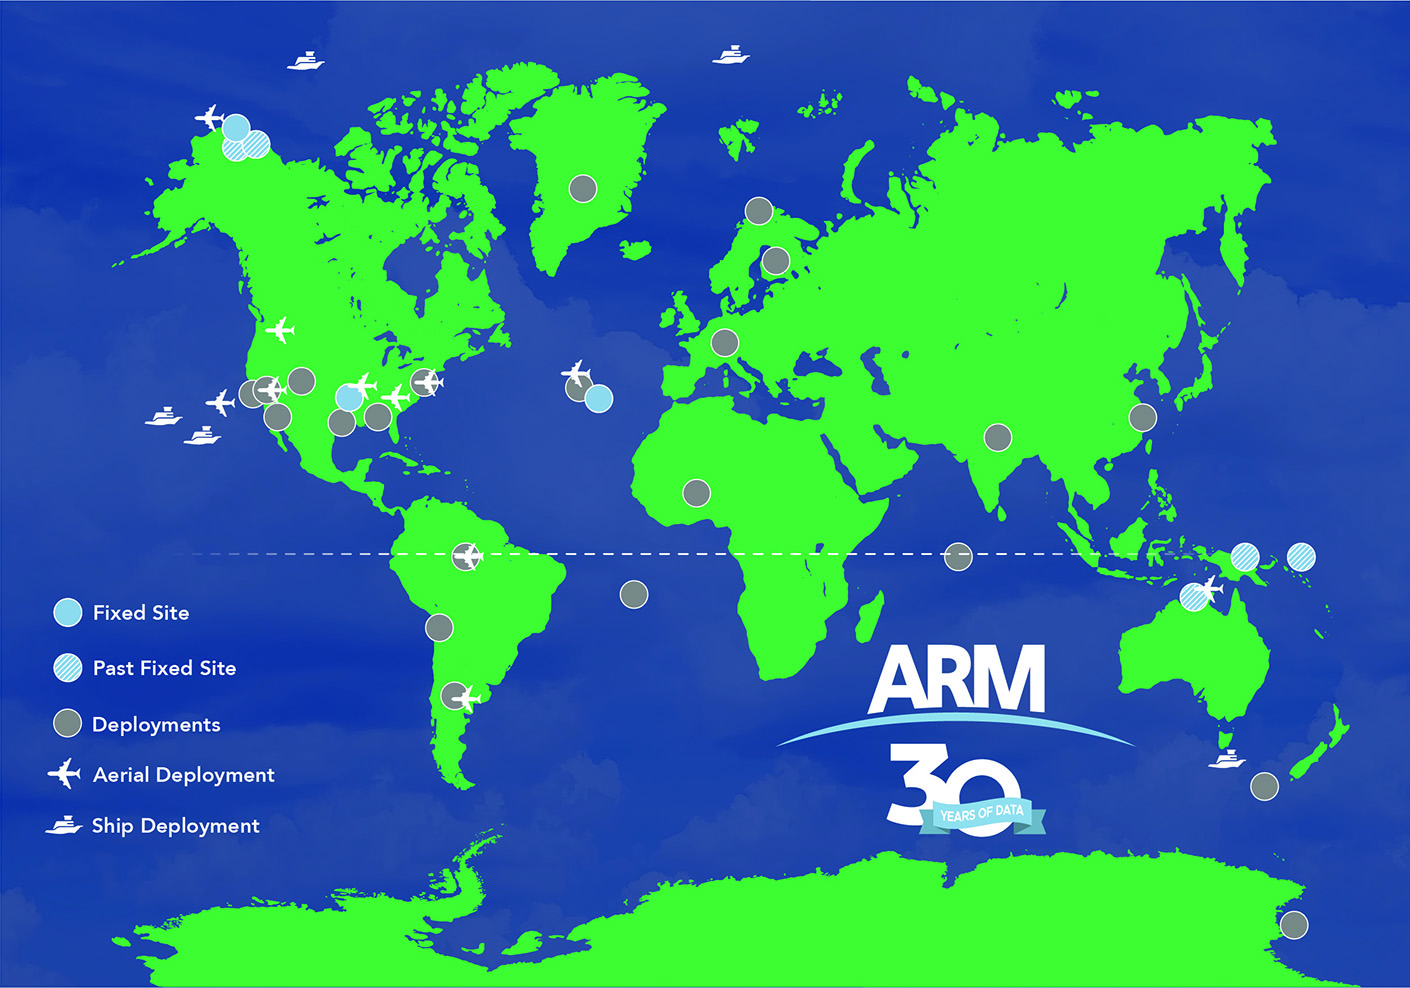
ARM data-gathering started in 1992 on a single instrument in a farm field in Oklahoma. Today, ARM commands more than 460 instruments worldwide. The user facility operates three fixed-location and three mobile observatories, and it also provides aerial capabilities.
ARM data are available from all seven continents and all five oceans.
Archived measurements include day-by-day records of temperature, wind speed, humidity, infrared radiation, cloud cover, atmospheric particles called aerosols, and dozens of other measures of the atmospheric processes that are critically important to weather and climate.
Inspiration for ARM
ARM arose as a concept in 1989 in response to early federal concerns about climate change. Its mission was to fill a knowledge gap in comprehensive measurements of atmospheric processes, with a focus on radiative transfer and clouds.
Before then, atmospheric scientists typically collected observational data during brief, intensive field campaigns that involved a lot of people and instruments from disparate institutions.
These campaigns were “like Genghis Khan and his hordes―very ad hoc,” says Gerry Stokes, who led the ARM Program Plan writing team in 1989 and soon became ARM’s first chief scientist. (He is now a visiting professor at Stony Brook University in New York.)
By contrast, says Stokes, ARM pioneered continuous observations in climate-critical places. The idea was to get data year after year while preserving large-scale collaboration.
Scientists need continuous, long-term atmospheric data to validate models and understand processes, says ARM Technical Director Jim Mather. “Understanding the climate presents a huge array of challenges. ARM was created to help with that.”
Partners and Progress
The ARM Program Plan writing team itself illustrated the wide net of collaboration ARM intended to cast.
In 1989, Stokes was at Pacific Northwest National Laboratory (PNNL) in Washington state. He represented the power of DOE and its collaborative national laboratories.
David H. Sowle, who died in 2018, was a physicist whose research on remote sensors happened in the private sector. Physical meteorologist Robert Ellingson, then a professor at the University of Maryland, College Park, foreshadowed ARM’s long present-day list of university partners. (Ellingson is now a professor emeritus at Florida State University.)
Back then, it was a bonus that Ellingson co-directed an experimental DOE field program called the SPECTral Radiance Experiment (SPECTRE). Its mission was to investigate the quantitative nature of spectral radiative transfer. SPECTRE was the prototype for ARM’s own atmospheric radiation mission.
From the 1989 plan emerged today’s ARM. Its operational responsibilities are spread across nine DOE Office of Science national laboratories.
Annually, ARM draws about 1,000 science users worldwide. The impact of ARM data can be measured in the number of related peer-reviewed papers―more than 4,200 since 1992, and now published at the pace of about 200 a year.
Mather and other ARM insiders say that, in the last 30 years, ARM introduced many concepts of observation, data management, instrument development, and collaboration that today are taken for granted around the world.
A Broad Array of Measurements
“We now have a multiyear look at how the atmosphere is evolving.”
Dave Turner, NOAA researcher and ARM veteran
Climate models are a primary tool for understanding how the whole earth system works together. But scientists need observations of the actual atmosphere to determine if models are accurate.
ARM is one of the only programs providing continuous comprehensive atmospheric observations, says Mather, who was part of campaigns in the 1990s. “There are many ARM-like operations around the world that collect climate- and weather-related data, but most are focused on a specific kind of measurement.”
Instead, ARM aims for a broad array of measurements, including interactions between the atmosphere and the surface in diverse meteorological regimes, says Mather. “That sets us pretty far apart.”
The duration of those measurements matters too.
A long record of measurements enables a great deal, says Mather, including “observation of extremes, recurrence of rare events, measurement of interannual variability, and―potentially―trends.”
Measurements at ARM’s Southern Great Plains (SGP) atmospheric observatory go back 30 years to that Oklahoma farm field. Those at the North Slope of Alaska (NSA) observatory started 25 years ago. Along the way, ARM collected almost 20 years of data at its Tropical Western Pacific (TWP) observatory. In addition, there is close to a decade of data from ARM’s Eastern North Atlantic (ENA) observatory in the Azores.
“We now have a multiyear look at how the atmosphere is evolving,” says ARM veteran Dave Turner, a NOAA researcher in Boulder, Colorado.
First, a Farm Field
ARM’s success in gathering data started small.
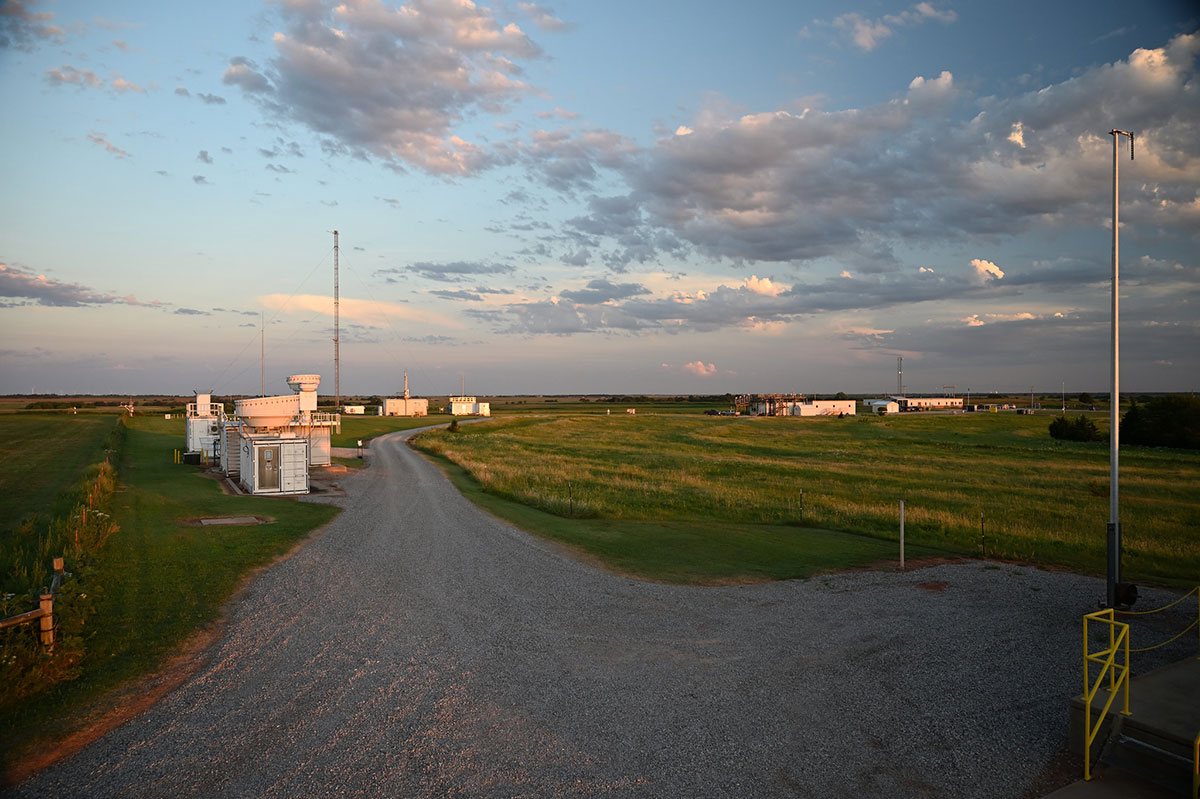
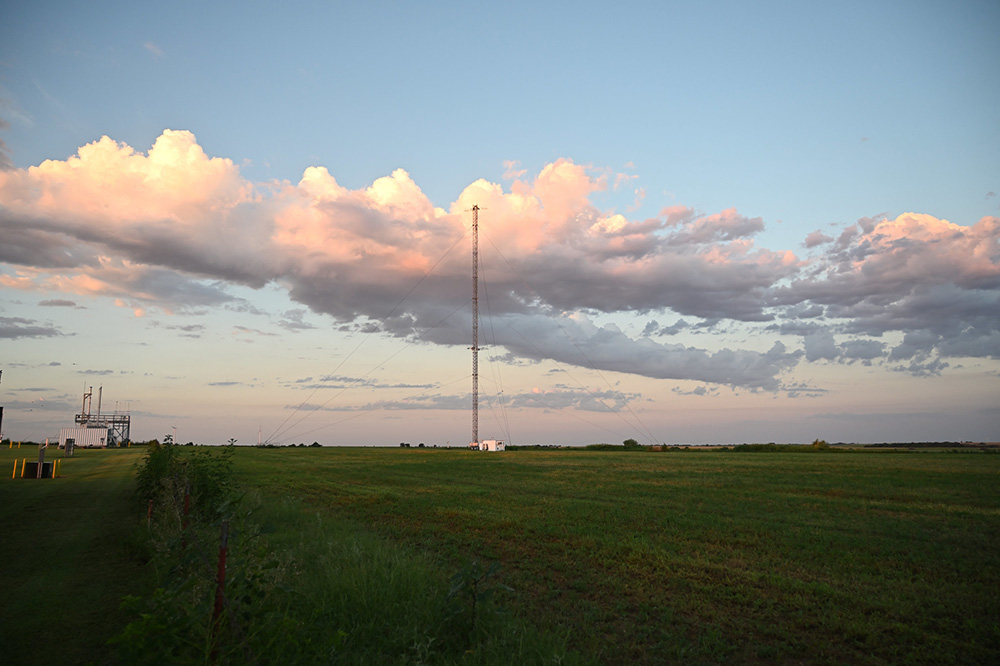
On May 16, 1992, ARM downloaded its first data from one instrument deployed on a leased pasture near Lamont, Oklahoma.
The SGP observatory was just starting to develop a 160-acre tract ARM calls the Central Facility. Before long, the SGP comprised 55,000 square miles of storm-swept Oklahoma and Kansas. (It has since shrunk to 9,000 square miles to gain operational efficiency.)
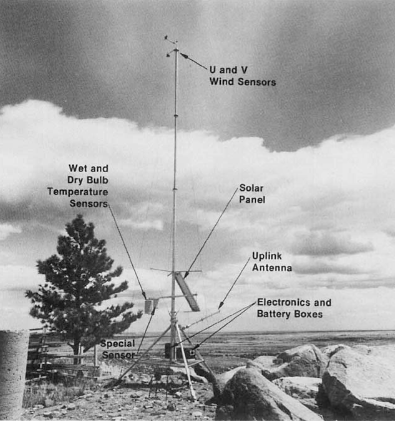
ARM’s first data came from a meteorological instrument array borrowed from the National Center for Atmospheric Research (NCAR) in Boulder, Colorado. In all, seven were installed in May 1992 by ARM project technicians Dan Nelson and Stan Tomich, both PNNL electrical engineers.
A Portable Automated Mesonet II (PAM II) was a gangly but robust array 10 meters (33 feet) high. Its platform was staked to the ground on a tripod. PAM II instruments recorded temperature, humidity, and wind speed.
An uplink antenna broadcast data to a NASA satellite at the rate of 9 bytes every 1.5 seconds. That’s the same as about nine letters of printed text.
By deploying PAM II systems borrowed from NCAR, “Gerry (Stokes) was trying to find something we could use right away,” says Tomich.
Today, these early data—considered “developmental data”—are not accessible to users. The earliest data file ARM users can access is from June 29, 1993, at the SGP.
From the days of PAM II on, ARM embraced an overarching mantra: Data must always have a known and reasonable quality, an operational imperative Stokes put in place. It required real-time quality control for every instrument; a standard format for measurements; and a way to document, process, and archive accrued data.
For giving ARM a good start three decades ago, Stokes credits PNNL’s pioneering work in residential energy monitoring, which involved tracking measurements from thousands of households in the Pacific Northwest. The project was “the start of the smart grid,” he says, and provided ARM with lessons in continuous monitoring and big-data management.
“We put a structure in place at ARM that did not choke on the data,” says Stokes.
Pioneering Field Campaigns
Field campaigns, proposed by scientists, complement continuous data from fixed observatories.
From 1992 onward, ARM has conducted about 700 campaigns—big and small, long and short—in climate-critical regions of the world.
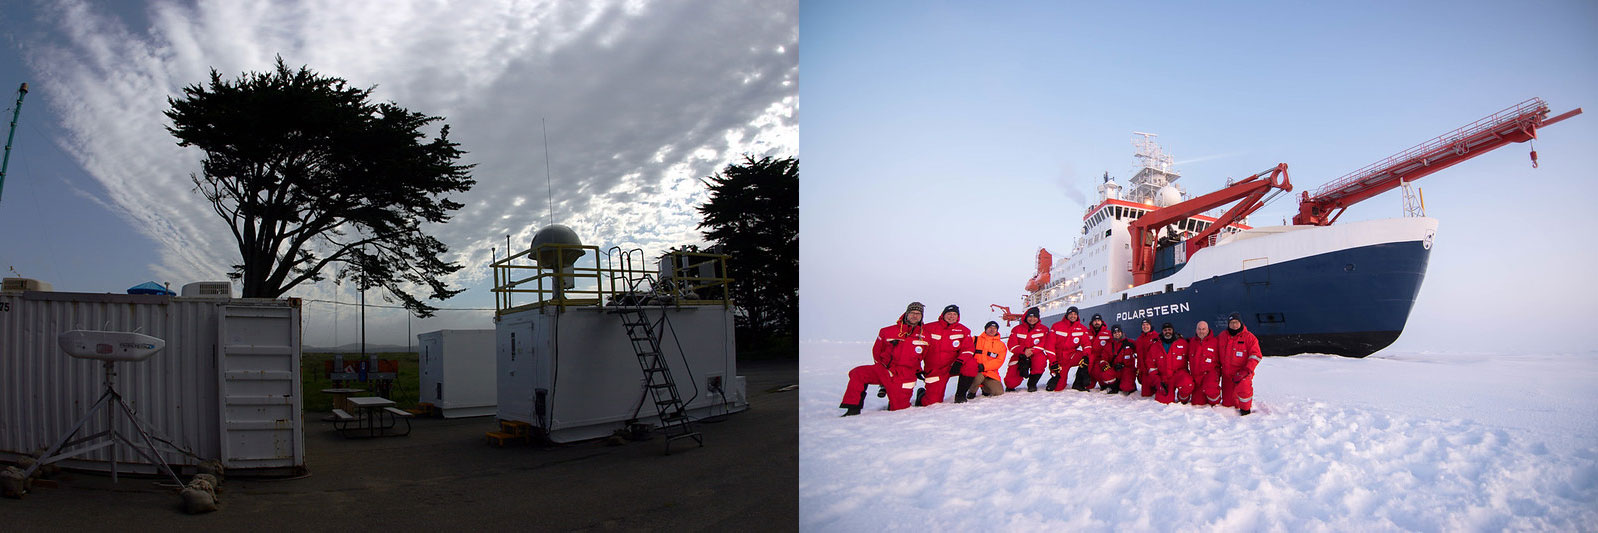
Since 2005, many of the large campaigns have used a unique ARM asset, container-based ARM Mobile Facilities (AMF). ARM deploys these portable, rugged observatories to under-sampled regions of the world.
These regions include storm-strafed continental land masses, the tropical western Pacific, the Arctic and its seas, and the cloud-decked eastern North Atlantic. ARM has pulled down data in the Amazon Basin, at extreme altitudes, and in complex mountain terrain that gives rise to thunderstorms. Its instruments and experts have also traveled to Scandinavia, where coastal boreal regions form transition zones between frigid polar climates and more temperate regimes.
Other research entities, such as NASA, NOAA, the National Science Foundation, and similar international organizations, also run field campaigns. These same entities have collaborated with ARM on field campaigns that yielded impactful data.
But ARM’s mobile facility field campaigns have some unique aspects. The mobile facilities operate similar comprehensive instrument suites to those at the ARM fixed sites, enabling easy comparisons of data between the mobile and fixed site locations. They also typically operate in a new location for six months to a year, which is longer than most traditional field campaigns. One particular AMF is deployed for five or more years at a time.
Coupling such mobile deployments with continuous measurements at fixed sites makes ARM “truly unique,” says Mather. “We were the first.”
Given the short-term nature of most AMF campaigns, their data seldom reflect interannual variability, cautions Mather. “But the compromise is that we are able to sample many locations.”
AMF assets add a lot of value to archived data, but in no way comprise the bulk of ARM’s field campaigns. Many are what ARM calls “small campaigns,” which can be proposed any time of the year, allow for guest instruments, and do not require large numbers of researchers or instruments.
Campaigns at this scale allow atmospheric researchers to leverage time at fixed or mobile observatories in pursuit of, says Mather, “a vast array of science goals.”
Data Advances
Housed at the ARM Data Center, 11,000-plus data products are freely accessible to users worldwide. ARM has also helped set international standards for data formats.
The European Union and others have similarly comprehensive data archives, says Turner. But ARM has twice as many years in the game.
More years means more data. ARM is on pace to add a petabyte a year, in part because of voluminous radar data and stored aids for modelers, including a large library of simulations informed by ARM data.
“There are more instruments and more raw data being saved,” says Turner. But size is not everything, he cautions.
“We have learned over time the importance of these data sets and how to better use those data,” says Turner. “In the end, the ARM data collection has become better.”
This includes advances in storing and distributing metadata, which provide context for raw measurements. For instance, regarding a given data point, where was the instrument located? How was it calibrated?
“The point is that better metadata makes data more findable and usable in a meaningful way,” says Turner. “That’s the success of ARM.”
Progressing to ARM Adulthood
Through 1998, ARM worked to establish the three original fixed sites (the SGP, NSA, and TWP). It also focused on learning how to operate various instruments to collect data efficiently.
ARM staff gained experience in moving and archiving data, understanding what metadata needed to be stored, and determining what sort of value-added processing could be done to enhance the data quality.
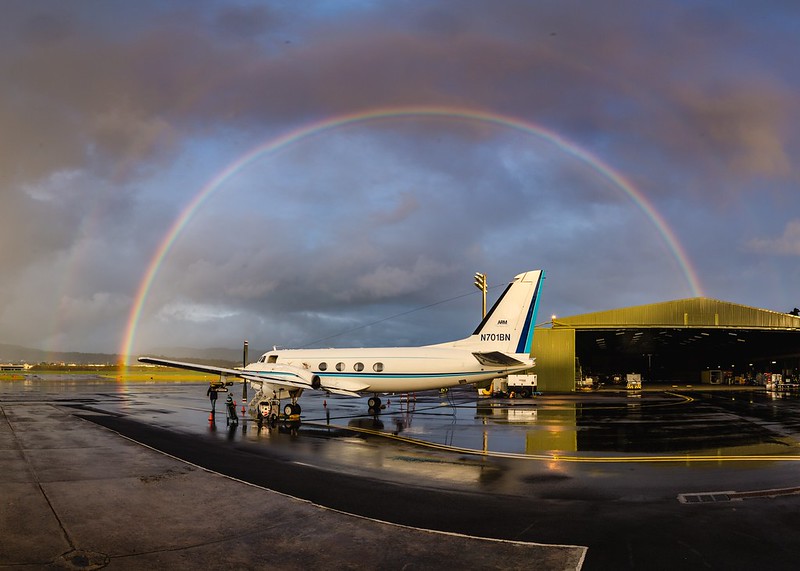
The “teenage years,” says Turner, stretched over the next decade or so. That’s when ARM solidified its research-aircraft assets and essentially solved the first of the two overarching scientific questions upon which the program was built: Given the atmospheric state and cloud properties, could scientists compute radiation accurately?
The answer is yes. In large part, ARM observations of realistic heating and cooling rates and other factors greatly improved representations of radiation, which are in use by modelers around the world.
“Now we are in adulthood,” says Turner of ARM. “Today, there are new tools coming along that we need to use better. As you become older, you get stronger and take on more responsibilities.”
A Focus Now on Clouds
Those responsibilities include addressing ARM’s second scientific question, which is still unsolved.
“Given the composition of the atmosphere,” asks Turner, “can scientists get clouds right in models?”
The same way ARM helped get radiation right? Not yet.
Being able to get clouds right in models requires being able to represent them in a realistic way. That’s difficult when cloud droplets are so tiny―20 to 100 microns wide. In addition, these droplets―aggregated into fast-moving fields of clouds, broken into hard-to-quantify fractions―must be represented in model grid cells that are kilometers wide.
In turn, there must be a way to represent how elusive cloud properties influence the distribution of water vapor.
These days, ARM is devoting a lot of effort to ways of representing clouds and aerosols in models. This ongoing challenge is part of ARM’s maturation.
“ARM has moved into (measuring) the whole earth system,” including the role of aerosols and how the atmosphere is linked to land, ocean, snow, and ice surfaces, says Turner. “You can’t think of the atmosphere without touching on the things that touch the atmosphere.”
Stories of Data—and People
Stokes, Mather, Turner, and other veteran observers of ARM praise the user facility for its increasingly sophisticated instruments. They also praise ARM’s deepening maturity as an accessible and free repository of atmospheric data.
But in the end, they all point to the same asset ARM has built up over three decades: its people.
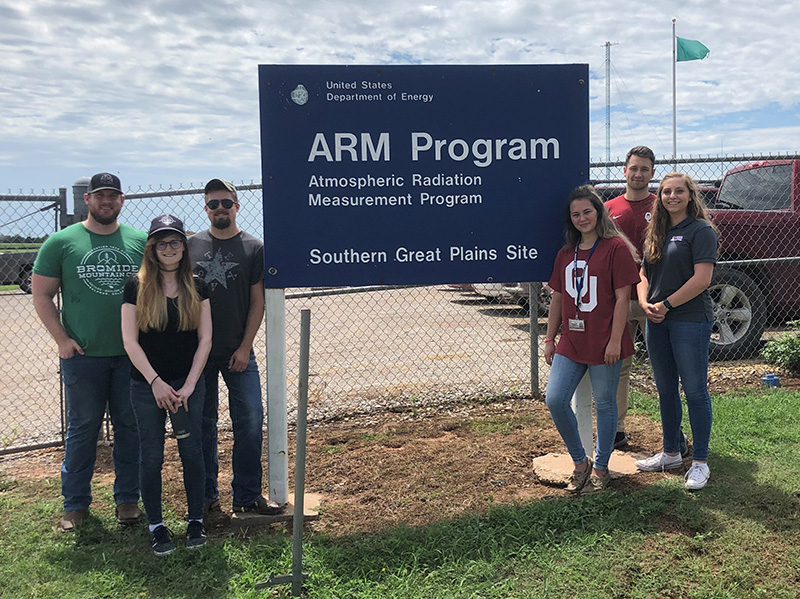
“ARM has always been a great place for young scientists,” says Turner. “Many have grown up in this program.”
One such scientist is Jessie Creamean at Colorado State University. She helps oversee the collection and analysis of aerosol samples from ARM sites and uses ARM data in her own papers.
Creamean struggled to fathom what atmospheric science would be like without the past three decades of ARM data.
“I could not even imagine,” she says. “An incredibly significant chunk of atmospheric data from sites all over the world would not be publicly available.”
ARM’s data and reach have grown. So has its staff. Today, ARM has more than 200, including managers, instrument mentors, site technicians, engineers, budgetary staff, and outreach specialists.
So many people. So much data. So many field deployments.
Hints Turner: “ARM has many stories.”
Through May 2023 on ARM.gov, follow our periodic features on ARM’s science impacts, the evolution of its data, and the contributions of its people. For more on the “ARM30” series, see the ARM30 main page.
Follow Us:


Keep up with the Atmospheric Observer
Updates on ARM news, events, and opportunities delivered to your inbox
ARM User Profile
ARM welcomes users from all institutions and nations. A free ARM user account is needed to access ARM data.


