

More New Features in Atmospheric data Community Toolkit
Published: 20 April 2023
Editor’s note: In January 2023, the White House Office of Science and Technology Policy launched the Year of Open Science to advance national open science policies across the federal government. During the year, ARM is publishing a series of stories on work to advance open and equitable research. The following is a blog post from the Atmospheric data Community Toolkit (ACT) team.
 The ACT team is back at it again with new releases since the last release announcement in September 2022. Also, ACT’s development team has been active in presenting the use of ACT for exploring data from the Surface Atmosphere Integrated Field Laboratory (SAIL) campaign, bridging scientific communities, and growing the ARM community through Python training. In part because of the ongoing education and outreach, ACT surpassed 100 stars on GitHub at the start of 2023. (Stars at a base level are a way for the community to “like” a repository.)
While the ACT team has been busy building up the user base, it has also been busy responding to additions to the ACT codebase. The current version sits at v1.4.3. Some of the latest features include:
Groupby Plots
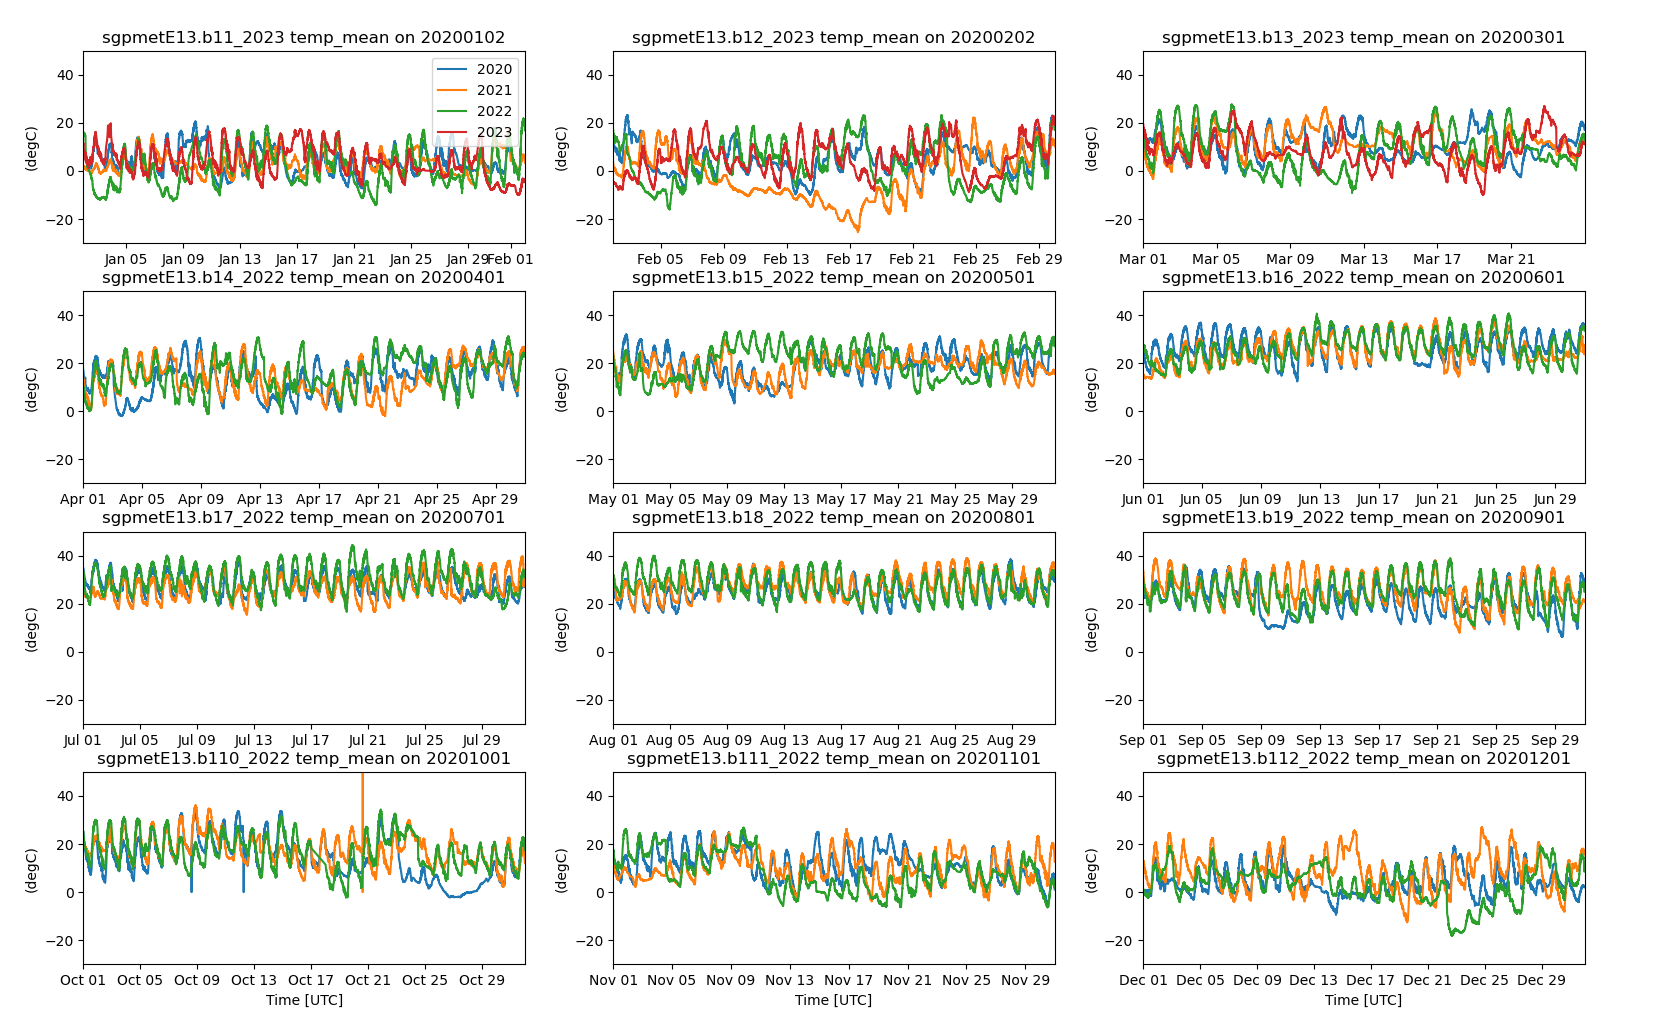
In analyzing data, sometimes it is important to be able to plot groups of data dependent on month, season, or other period of time. In ACT, Bobby Jackson recently added the ability to create plots that are grouped by such timelines.
Figure 1 shows an example of how this functionality can be used to group years’ worth of temperature data from the Southern Great Plains (SGP) E13 surface meteorology system into 12 monthly plots with the data color-coded by year. This functionality is available with all the other plot types in ACT.
New Code for Old Radars
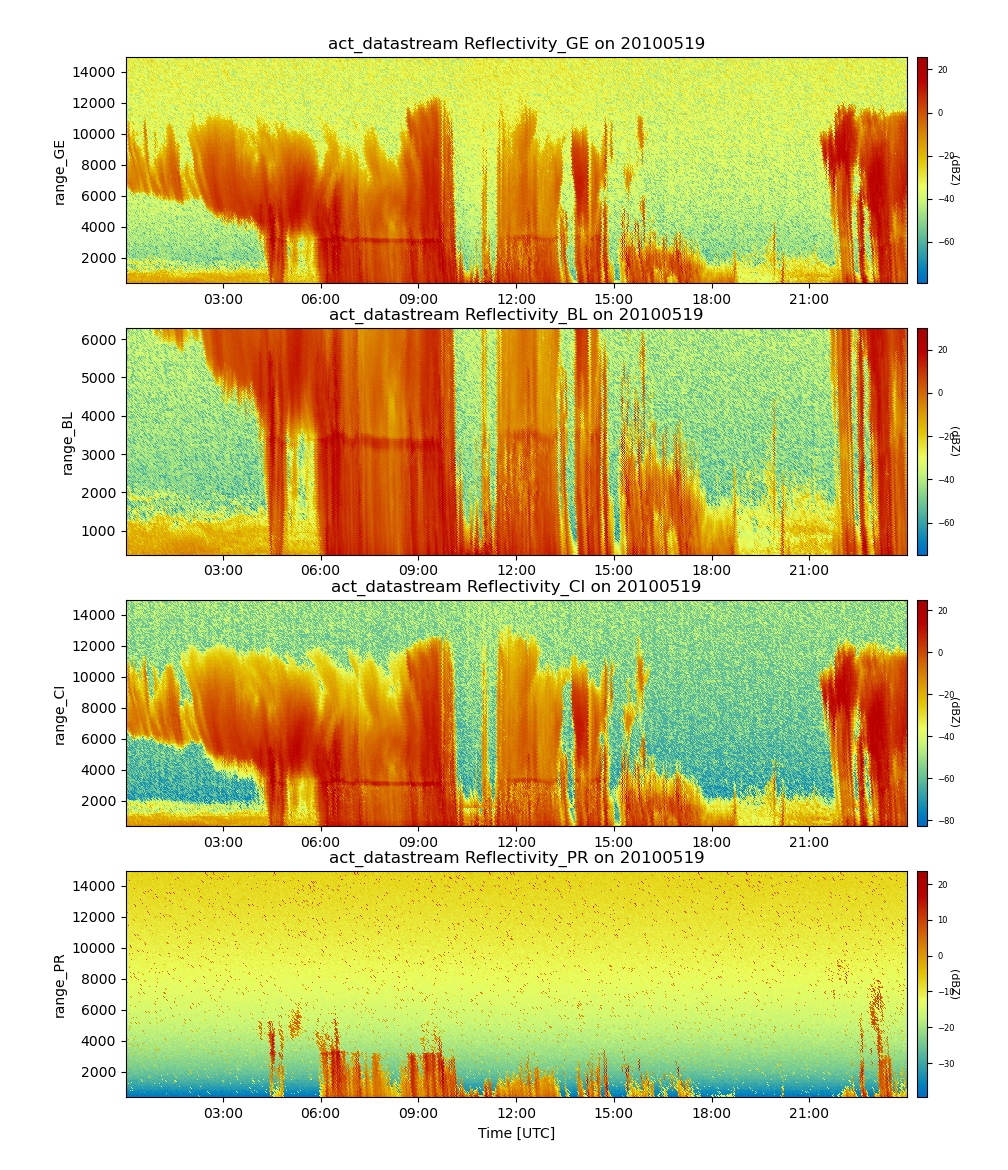
The millimeter wavelength cloud radar (MMCR), a predecessor to the current Ka-Band ARM Zenith Radar (KAZR), operated from 1996 to 2011. ARM has a lot of valuable MMCR data, but the file format does not make the data easy to read using conventional libraries in Python.
The ACT team developed a new function to read in the data and parse the individual operating modes into separate variables. Previously, these were interwoven into a single variable, which added to the difficulty of using the data.
Four modes can be seen in Figure 2 for a convective event from May 19, 2010, at the SGP.
Streamlined Access to External Data Sets
The ACT team added codes to read in S-band radar data from the NOAA Profiler Network data portal to build on ARM’s proximity to NOAA instruments during SAIL in Colorado and the upcoming ARM Mobile Facility deployment in Alabama.
Information on how to use ACT to work with both ARM and NOAA data can be found in this blog post by Zach Sherman.
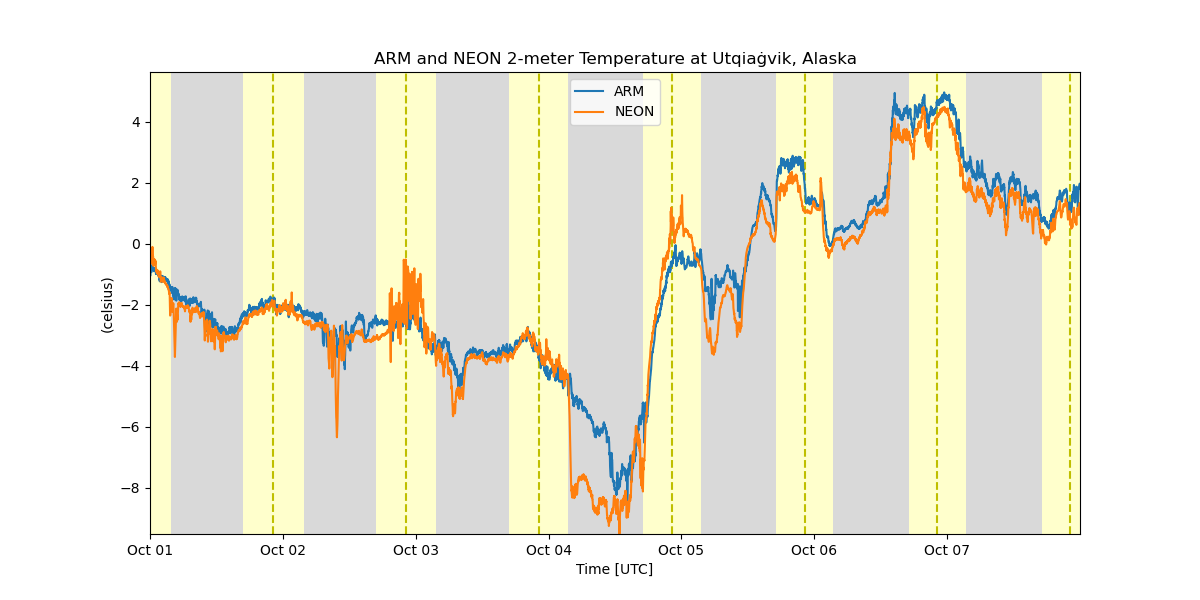
In addition, ACT includes new functionality to download and read in data from the National Science Foundation’s National Ecological Observatory Network (NEON), which has a flux/meteorological tower near ARM’s North Slope of Alaska observatory. This can be useful for expanding the measurements available to ARM users and for added checks on ARM’s meteorological tower data (see Figure 3 for an example data plot from the ARM and NEON systems).
Other Features
Since the last release announcement, ACT has had 12 contributors and 87 commits (the total number of times code has been contributed) with an array of enhancements, bug fixes, and new features. These include the implementation of lazy loading (only loading code when it’s needed) by Max Grover to greatly improve the import time of ACT, tar and gzip file support added by Ken Kehoe, and the addition of examples by Joe O’Brien and others.
‘Git’ Involved!
If you still have not checked out ACT, now’s the time! If you have already started using ACT, be sure to upgrade to the latest version to take advantage of the latest features.
As always, ACT’s development team is available to respond to questions on GitHub in the Discussions area or to problems or concerns that are reported in the Issues area. To ask a question, report an issue, or get to ACT’s documentation and examples, head on over to ACT’s GitHub page.
–ACT Team
Follow Us:


Keep up with the Atmospheric Observer
Updates on ARM news, events, and opportunities delivered to your inbox
ARM User Profile
ARM welcomes users from all institutions and nations. A free ARM user account is needed to access ARM data.


