

Growing the ARM Community Through Python Training
Published: 24 October 2022
Editor’s note: Max Grover, a software developer at Argonne National Laboratory, led a Python workshop as part of the 2022 Midwest Student Conference on Atmospheric Research (MSCAR). Grover provided the following blog post about the workshop.
MSCAR 2022 was held October 1 and 2 at the University of Illinois Urbana-Champaign. This is a conference planned by students, with the conference experience centered around students. Graduate students from the Department of Atmospheric Sciences planned the sixth annual MSCAR, which included a variety of keynote talks, oral and poster presentations by students, a career fair, and workshops!
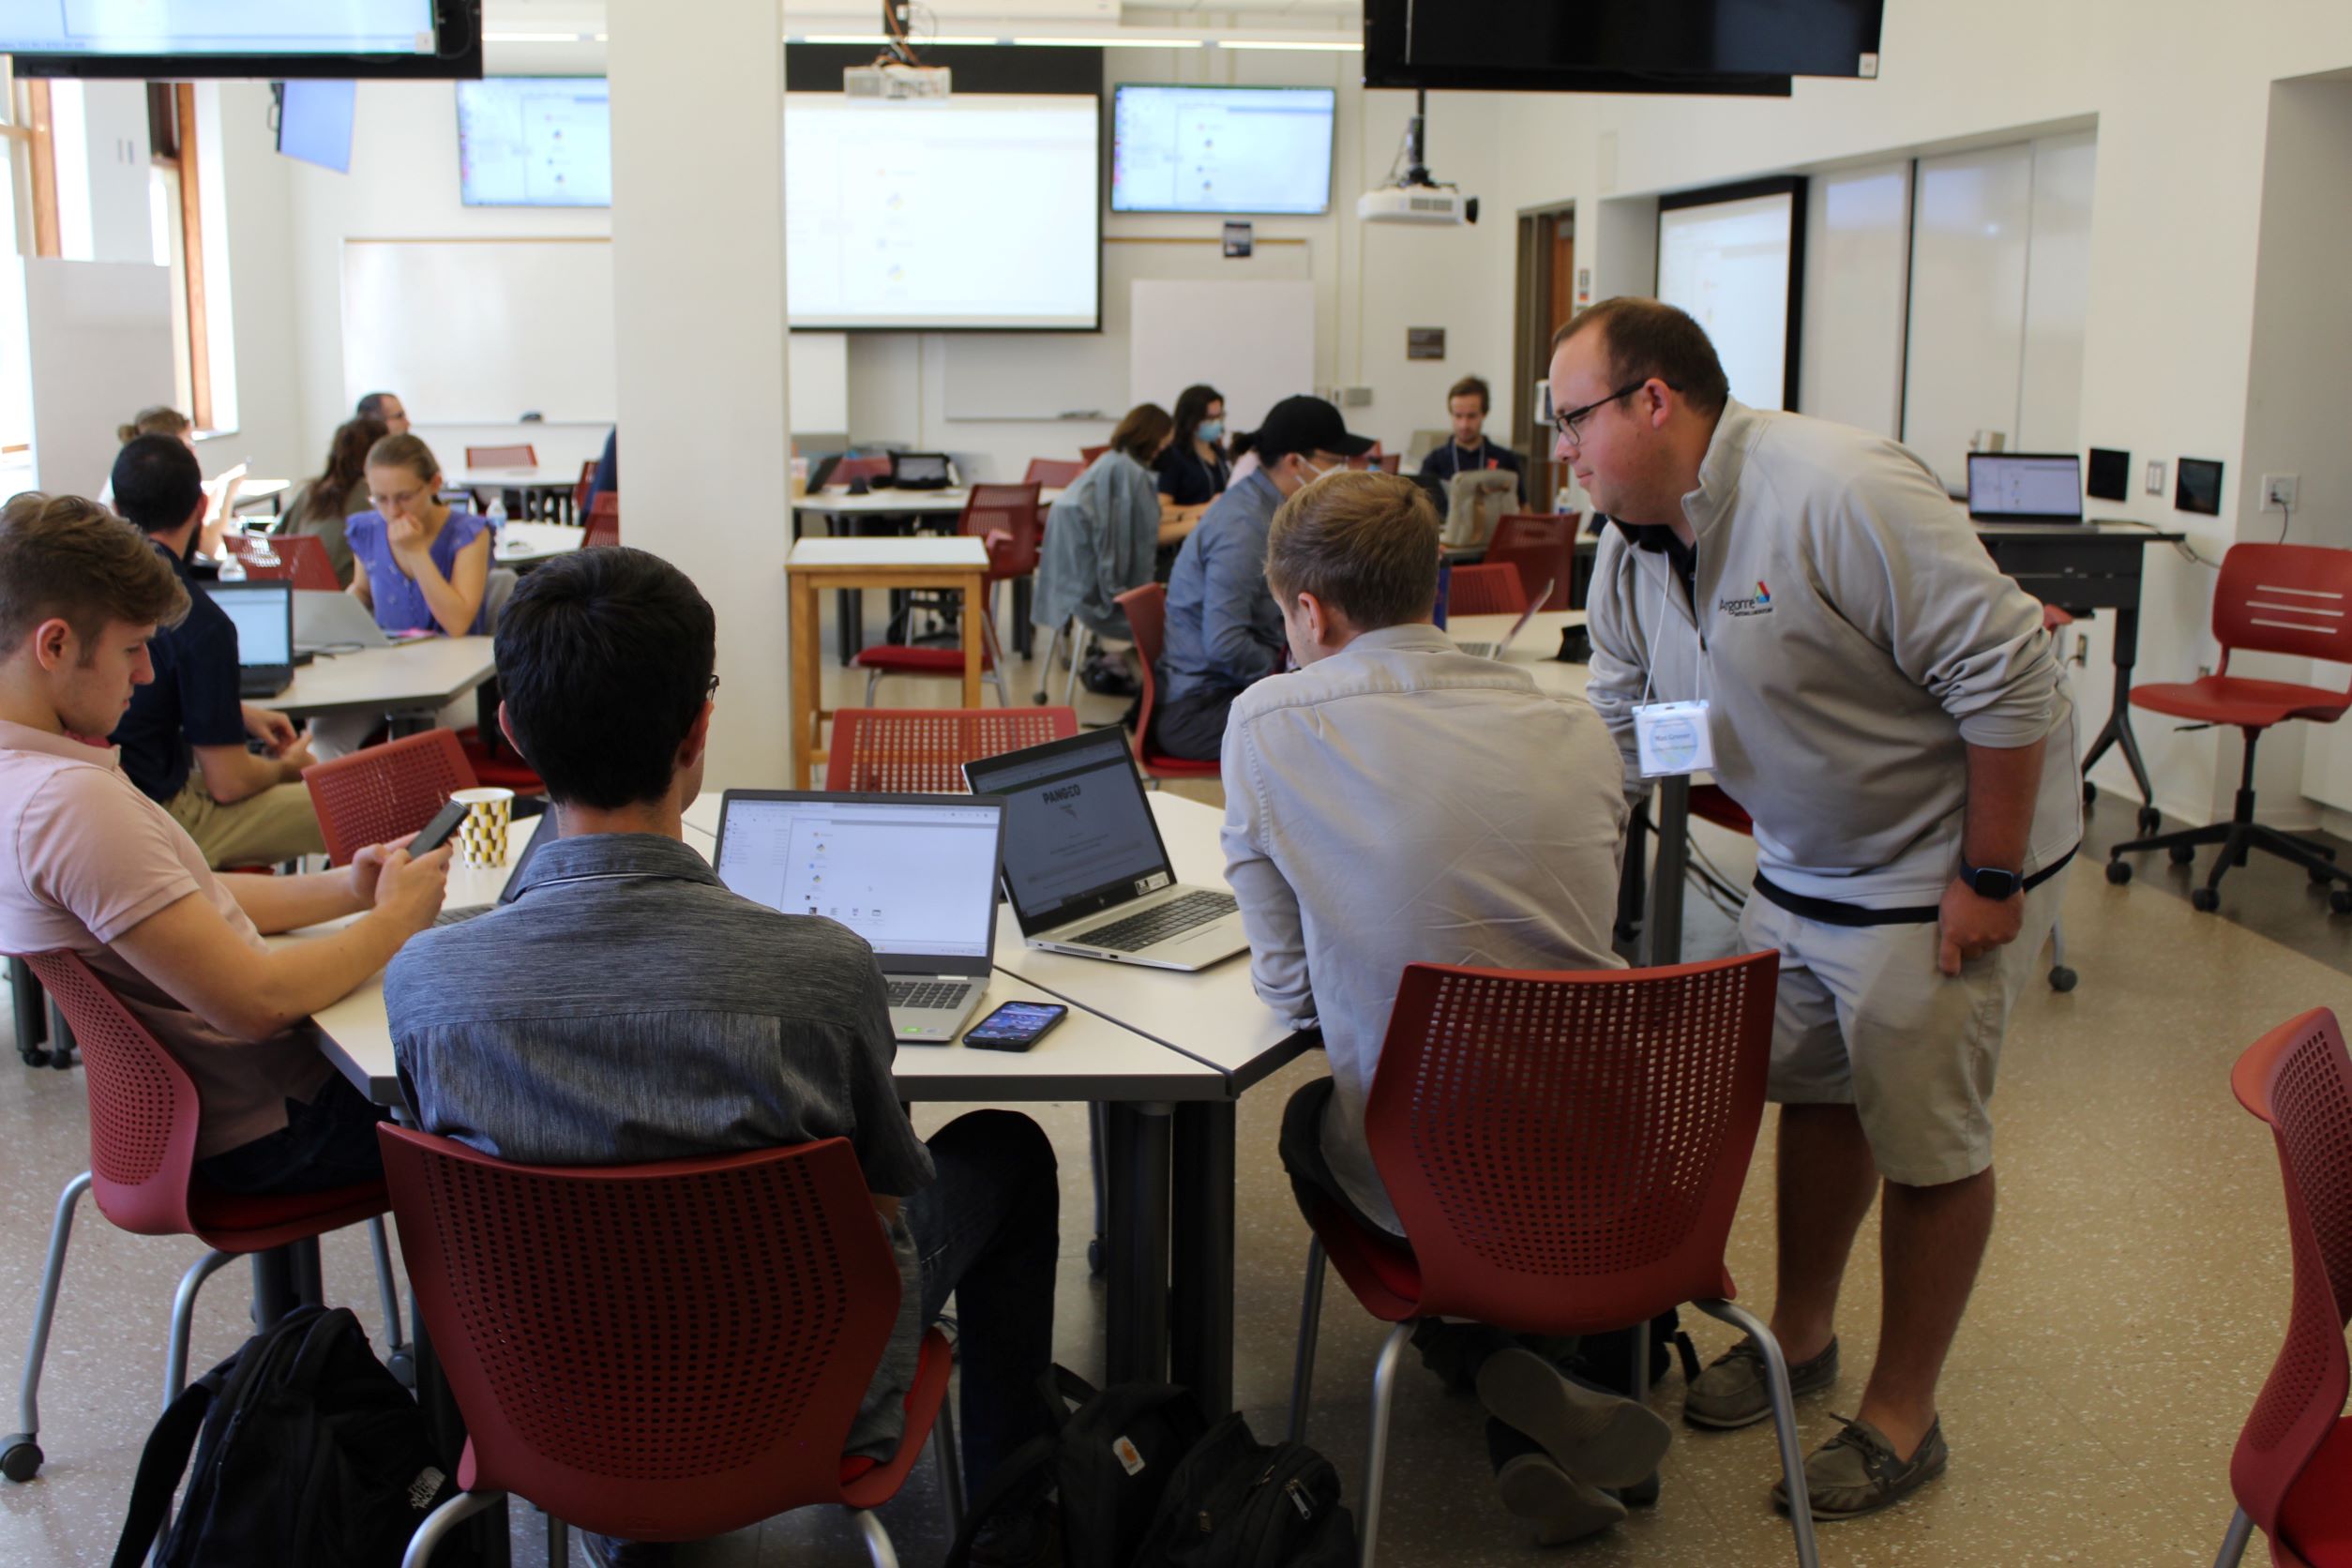
Max Grover, a previous chair of the conference, organized one of two workshops on the second day of MSCAR 2022. The workshop was titled “Python for Atmospheric Science,” with a tutorial focusing on ARM-supported software packages as well as other packages in the scientific Python ecosystem. Zach Sherman, also a software developer at Argonne National Laboratory, helped with the workshop as well, answering questions from remote participants.
More than 60 undergraduate and graduate students attended the workshop, with a mixture of in-person and virtual participants. While most of the in-person participants were from universities in the Midwest (e.g., University of Wisconsin–Madison, University of Illinois Urbana-Champaign, University of Michigan), remote participants from around the world were able to attend. Some students logged in from California and South America.
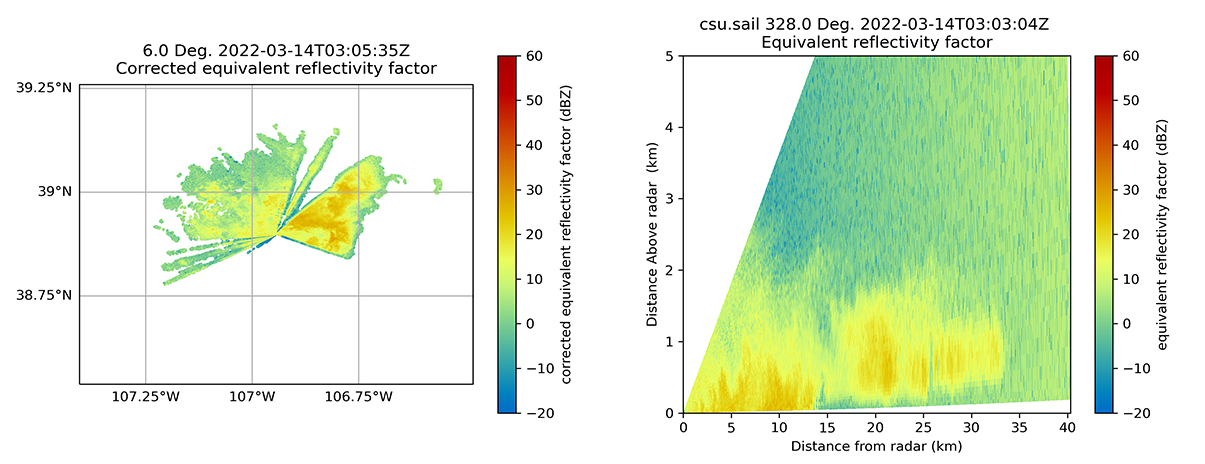
The sample data sets for the tutorial were collected during ARM’s ongoing Surface Atmosphere Integrated Field Laboratory (SAIL) campaign.
Radar Data With Py-ART
The first part of the workshop focused on working with radar data using the Python ARM Radar Toolkit (Py-ART). Py-ART has a suite of tools that make working with radar data in Python much easier—and also fun.
Students learned the basics of how to read, visualize, and extract additional retrievals from their data sets. Gridding tools were discussed as well, with students particularly interested in how they could use these examples to compare their observations with models.
Observations With ACT
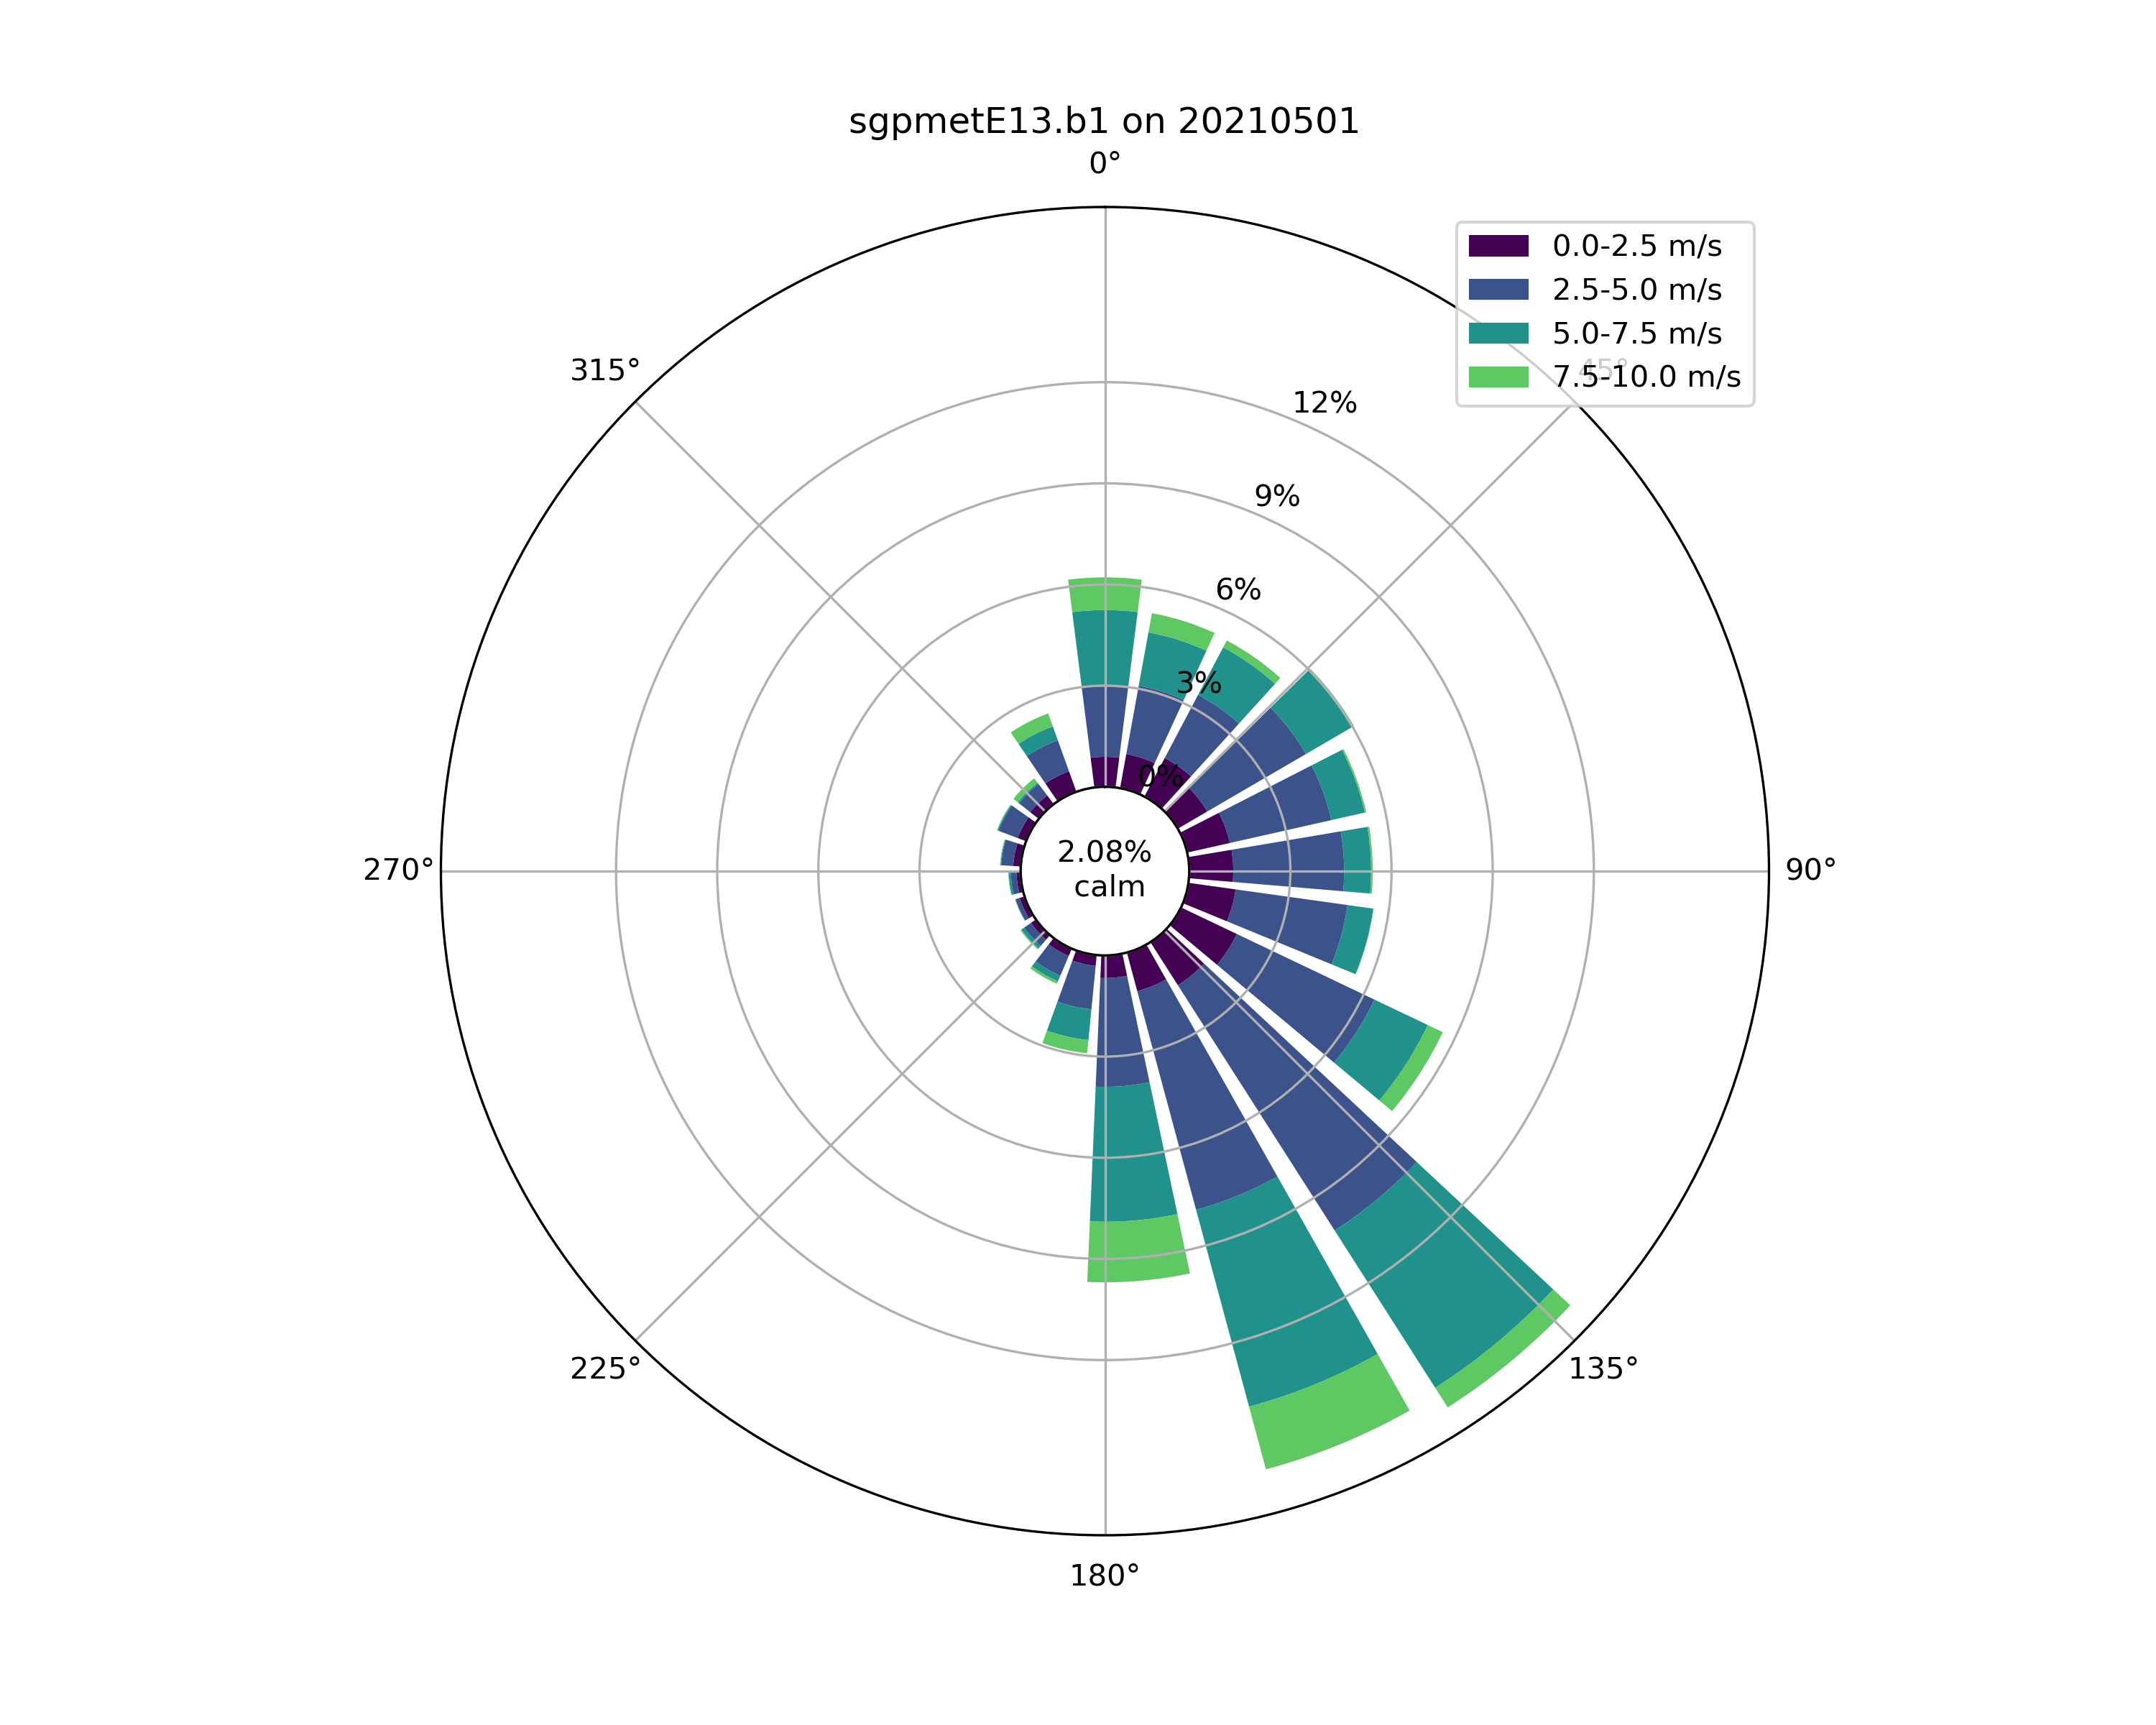
Following Py-ART, the tutorial moved on to working with other observational data sets collected by ARM, such as atmospheric radiation data, using the Atmospheric data Community Toolkit (ACT).
ACT is an amazing toolkit that focuses on using a common data model, Xarray data sets, to represent different data sets. The “ACT for Science” blog post from September describes how the community is using these tools quite well!
Students learned how to read in and plot atmospheric radiation data, view quality control flags, and add their own flags too!
Pangeo Packages
The last part of the workshop dug into key components of the Pangeo ecosystem. Pangeo is “a community promoting open, reproducible, and scalable science,” with the key package within this space being Xarray.
Xarray enables users to work with their weather and climate data more easily in Python, working seamlessly with complementary packages such as Dask, hvPlot, and Matplotlib. This collection of tools enables researchers to analyze gigabytes, terabytes, and sometimes even petabytes of data with ease!
Max and Zach proceeded to walk through the basics of the Xarray package as well as how to create interactive plots using data from one of ARM’s most popular instruments, the Ka-Band ARM Zenith Radar (KAZR).
Conclusions
Max and Zach made sure to thank the organizers of MSCAR for organizing such a wonderful event and inviting ARM to play a small part in the conference.
The tutorial content itself, including the software, data, and platform, can be accessed using this link.
Make sure to follow the instructions detailing how to run on the cloud or on your local machine.
ARM is sponsoring a longer workshop—a dedicated American Meteorological Society (AMS) short course—on January 8, 2023, at the AMS Annual Meeting in Denver, Colorado. The course will use SAIL data and tools featured during the MSCAR tutorial. Those interested in using open-source tools and open data should look for upcoming announcements about this course and sign up when the registration opens. Bookmark this page to check back for updates.
Follow Us:


Keep up with the Atmospheric Observer
Updates on ARM news, events, and opportunities delivered to your inbox
ARM User Profile
ARM welcomes users from all institutions and nations. A free ARM user account is needed to access ARM data.


