

ACT for Science: Use New Features in Open-Source Toolkit
Published: 23 September 2022
The Atmospheric data Community Toolkit (ACT) regularly adds new features. We will highlight a number of these on the “ACT for Science” poster led by Zachary Sherman at October’s Joint ARM User Facility/Atmospheric System Research (ASR) Principal Investigators (PI) Meeting, but here’s a look at some of the latest features included with the recent release of version 1.2.0.
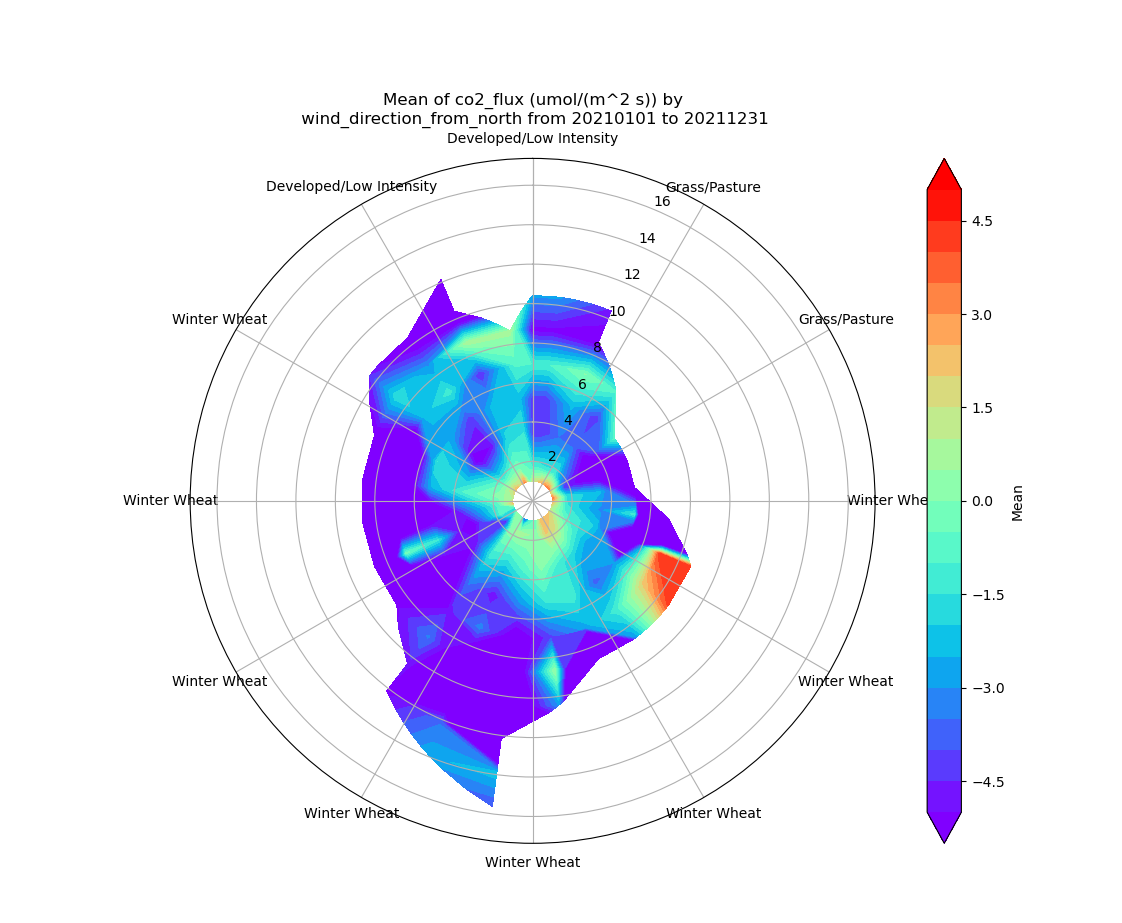
Data Roses
Wind roses show the distribution of wind speed and direction, but a new plotting routine in ACT can display the distribution of data based on wind direction and speed.
The example in Figure 1 shows the mean CO₂ flux based on wind direction and speed for all the 2021 eddy correlation (ECOR) flux measurement system data at the Southern Great Plains extended facility E14 near Lamont, Oklahoma. In this example, crop type is easily overlaid after pulling the information from the U.S. Department of Agriculture CropScape web service, for which ACT has a function.
Additional examples and options can be found on our recently updated documentation page.
Enabling Easier Access to Other Organizations’ Data
The second ARM Mobile Facility is deployed near Crested Butte, Colorado, in support of the Surface Atmosphere Integrated Field Laboratory (SAIL) campaign. Similarly, NOAA has instrumentation deployed in the same region in support of the Study of Precipitation, the Lower Atmosphere and Surface for Hydrometeorology (SPLASH).
In addition, as ARM prepares to deploy the third ARM Mobile Facility to northern Alabama, there are NOAA assets in the region that can benefit research by ARM users.
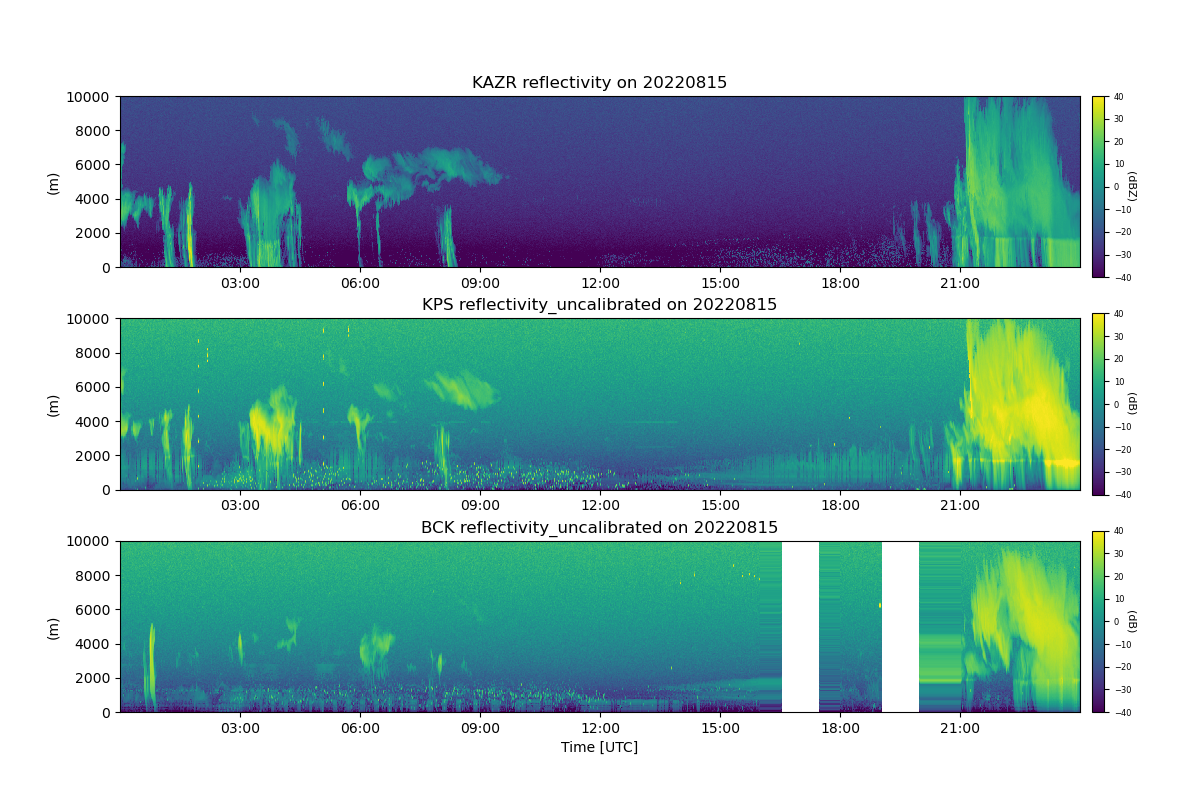
Data products from NOAA and ARM are in different formats, and it takes added effort to work with data from both organizations. Recent code additions to ACT make it easy to download data from the NOAA Physical Science Laboratory’s FTP site and read it into an Xarray data set, which is used throughout all of ACT’s functions. Currently, the read capability is limited to the Parsivel disdrometer, surface meteorology system, radar wind profiler, and frequency-modulated continuous wave (FMCW) radars (Figure 2), but is expected to expand to more instruments.
Greater ARM Aerial Facility Support
The second ACT roadmap states that increasing the offerings available in ACT for aerial data will be beneficial, and it’s listed as a high priority. This comes in preparation for continued flights of ARM’s ArcticShark uncrewed aerial system and for the new crewed research aircraft (currently undergoing modifications) to come online in the future.
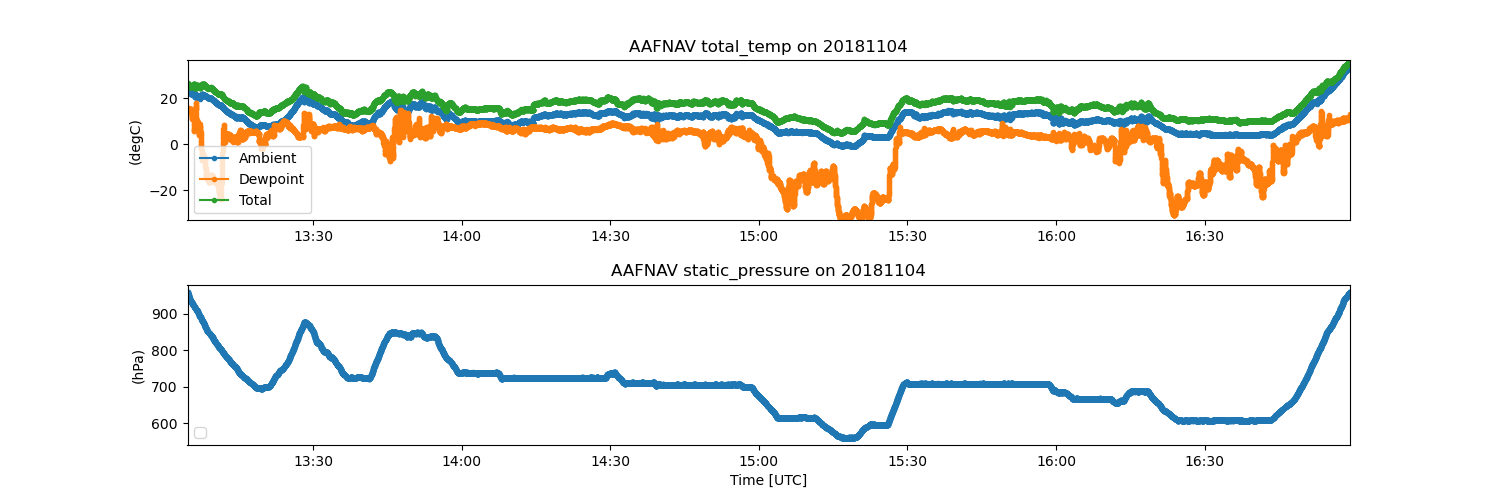
The ability to read ICARTT-formatted files was recently added to ACT (Figure 3). These ICARTT files are available through ARM’s Data Discovery when downloading ARM Aerial Facility data in ASCII format. This capability requires the installation of an existing library (icartt) developed and maintained by researchers from the University of Augsburg.
A full example of how easy it is to read ICARTT data and plot using ACT is available here.
ACT in Action
Nine University of Washington students traveled to Richland, Washington, to take a two-week instrumentation short course taught by scientists and engineers, many of them ARM instrument mentors, at Pacific Northwest National Laboratory. The course took place from September 12 to 22.
Focusing on themes such as calibration and accuracy, instructors developed lectures on ground and airborne instrumentation and measurements, data management, and atmospheric chemistry and cloud microphysics.
There’s a lot more in ACT that’s been added recently and more planned, so please go check out the documentation and example pages for more information on ACT, and don’t forget to stop by our poster at the PI meeting!
University of Washington professor Lynn McMurdie and PNNL earth scientist Lexie Goldberger co-organized the course. Instructors augmented lectures through experiments, demonstrations, mock field campaign designs, field trips, and computer analyses (including a short introduction to ACT and how it can be used to visualize data).
An introduction to ACT and how it can be used to enable open science will also be covered during a Python workshop, led by Maxwell Grover of Argonne National Laboratory, at the Midwest Student Conference on Atmospheric Research (MSCAR) in October. MSCAR is an event hosted by graduate students at the University of Illinois Urbana-Champaign, The workshop will detail how to use ACT as well as other open-source packages, such as the Python ARM Radar Toolkit (Py-ART).
At the American Meteorological Society (AMS) Annual Meeting in January 2023, an ARM team will teach a short course detailing how to use ACT and other open-source tools to work with SAIL measurements. The short course will detail how to use ACT and other ARM toolkits to analyze different data sets from the campaign, including precipitation, radiation, and hydrological measurements. Registration details will be made available soon.
There’s a lot more in ACT that’s been added recently and more planned, so please go check out the documentation and example pages for more information on ACT, and don’t forget to stop by our poster at the PI meeting!
–ACT Team
Follow Us:


Keep up with the Atmospheric Observer
Updates on ARM news, events, and opportunities delivered to your inbox
ARM User Profile
ARM welcomes users from all institutions and nations. A free ARM user account is needed to access ARM data.


