

AGU Scoop: Wind and the Southern Great Plains
Published: 17 December 2020
Editor’s note: ARM science writers are contributing blog posts during the 2020 American Geophysical Union (AGU) Fall Meeting. Check back often for updates! All times listed are Pacific. For meeting-specific links, use your AGU login to view.
December 16, 2020
How the Seasons Affect Wind Energy
Low-level jets are fast-moving streams of air in the lowest kilometer (0.6 miles) of the atmosphere. They can transport heat and moisture at 80 mph or more during so-called low-level jet (LLJ) “events.”
Importantly, LLJs also deliver increased kinetic energy to the rotors that drive wind turbines.
“These are very important events for wind farm production,” said Vincent Pronk, part of the Julie K. Lundquist research group at the University of Colorado, Boulder.
Pronk delivered a December 16 AGU poster flash talk on three LLJ cases, one for each two- or four-day interval in February, April, and June. Lundquist was his co-author.
It turns out that the effect of wind farm wakes on LLJs may depend on the season. (Wind farm wakes are aerodynamic events caused by aggregations of wind turbines. They may alter local wind speeds and temperatures.)
The Pronk-Lundquist work, also summarized in an abstract, used the three LLJ cases to demonstrate how seasons affect wind farm wakes. They employed the Weather Research and Forecasting model and focused on ARM’s Southern Great Plains atmospheric observatory in Oklahoma, where years of data could be used to test the efficacy, or “skill,” of the model.
How would the seasons, the researchers asked, affect forecasting important wind-energy variables? These include the height of the boundary layer, atmospheric stability, and wind speed and turbulence at the height of a wind turbine’s hub.
To validate the skill of the model, Pronk and Lundquist used surface-station measurements as well as wind and turbulence profiles.
Among the findings: Compared with observations, simulations without the wind farms performed better than simulations that included them.
The authors say their study provides new insights into the impact of the seasons on wind farm wakes.
–Corydon Ireland
Wind Turbines and Local Weather
Downwind from the rotating blades of a wind turbine, slower and more turbulent winds fan out over the landscape. Even single turbines create these wakes of moving air, but in calm conditions, aggregations of wind farm wakes can persist up to 50 kilometers (31 miles) away. In stormy weather―convective conditions―these wakes rapidly erode.
Wind farm wakes affect local meteorology, a phenomenon investigated by Julie K. Lundquist of the University of Colorado, Boulder, and the National Renewable Energy Laboratory (NREL). She and NREL co-author Nicola Bodini, a wind turbulence analyst, outlined their work in an AGU2020 poster presented December 16.
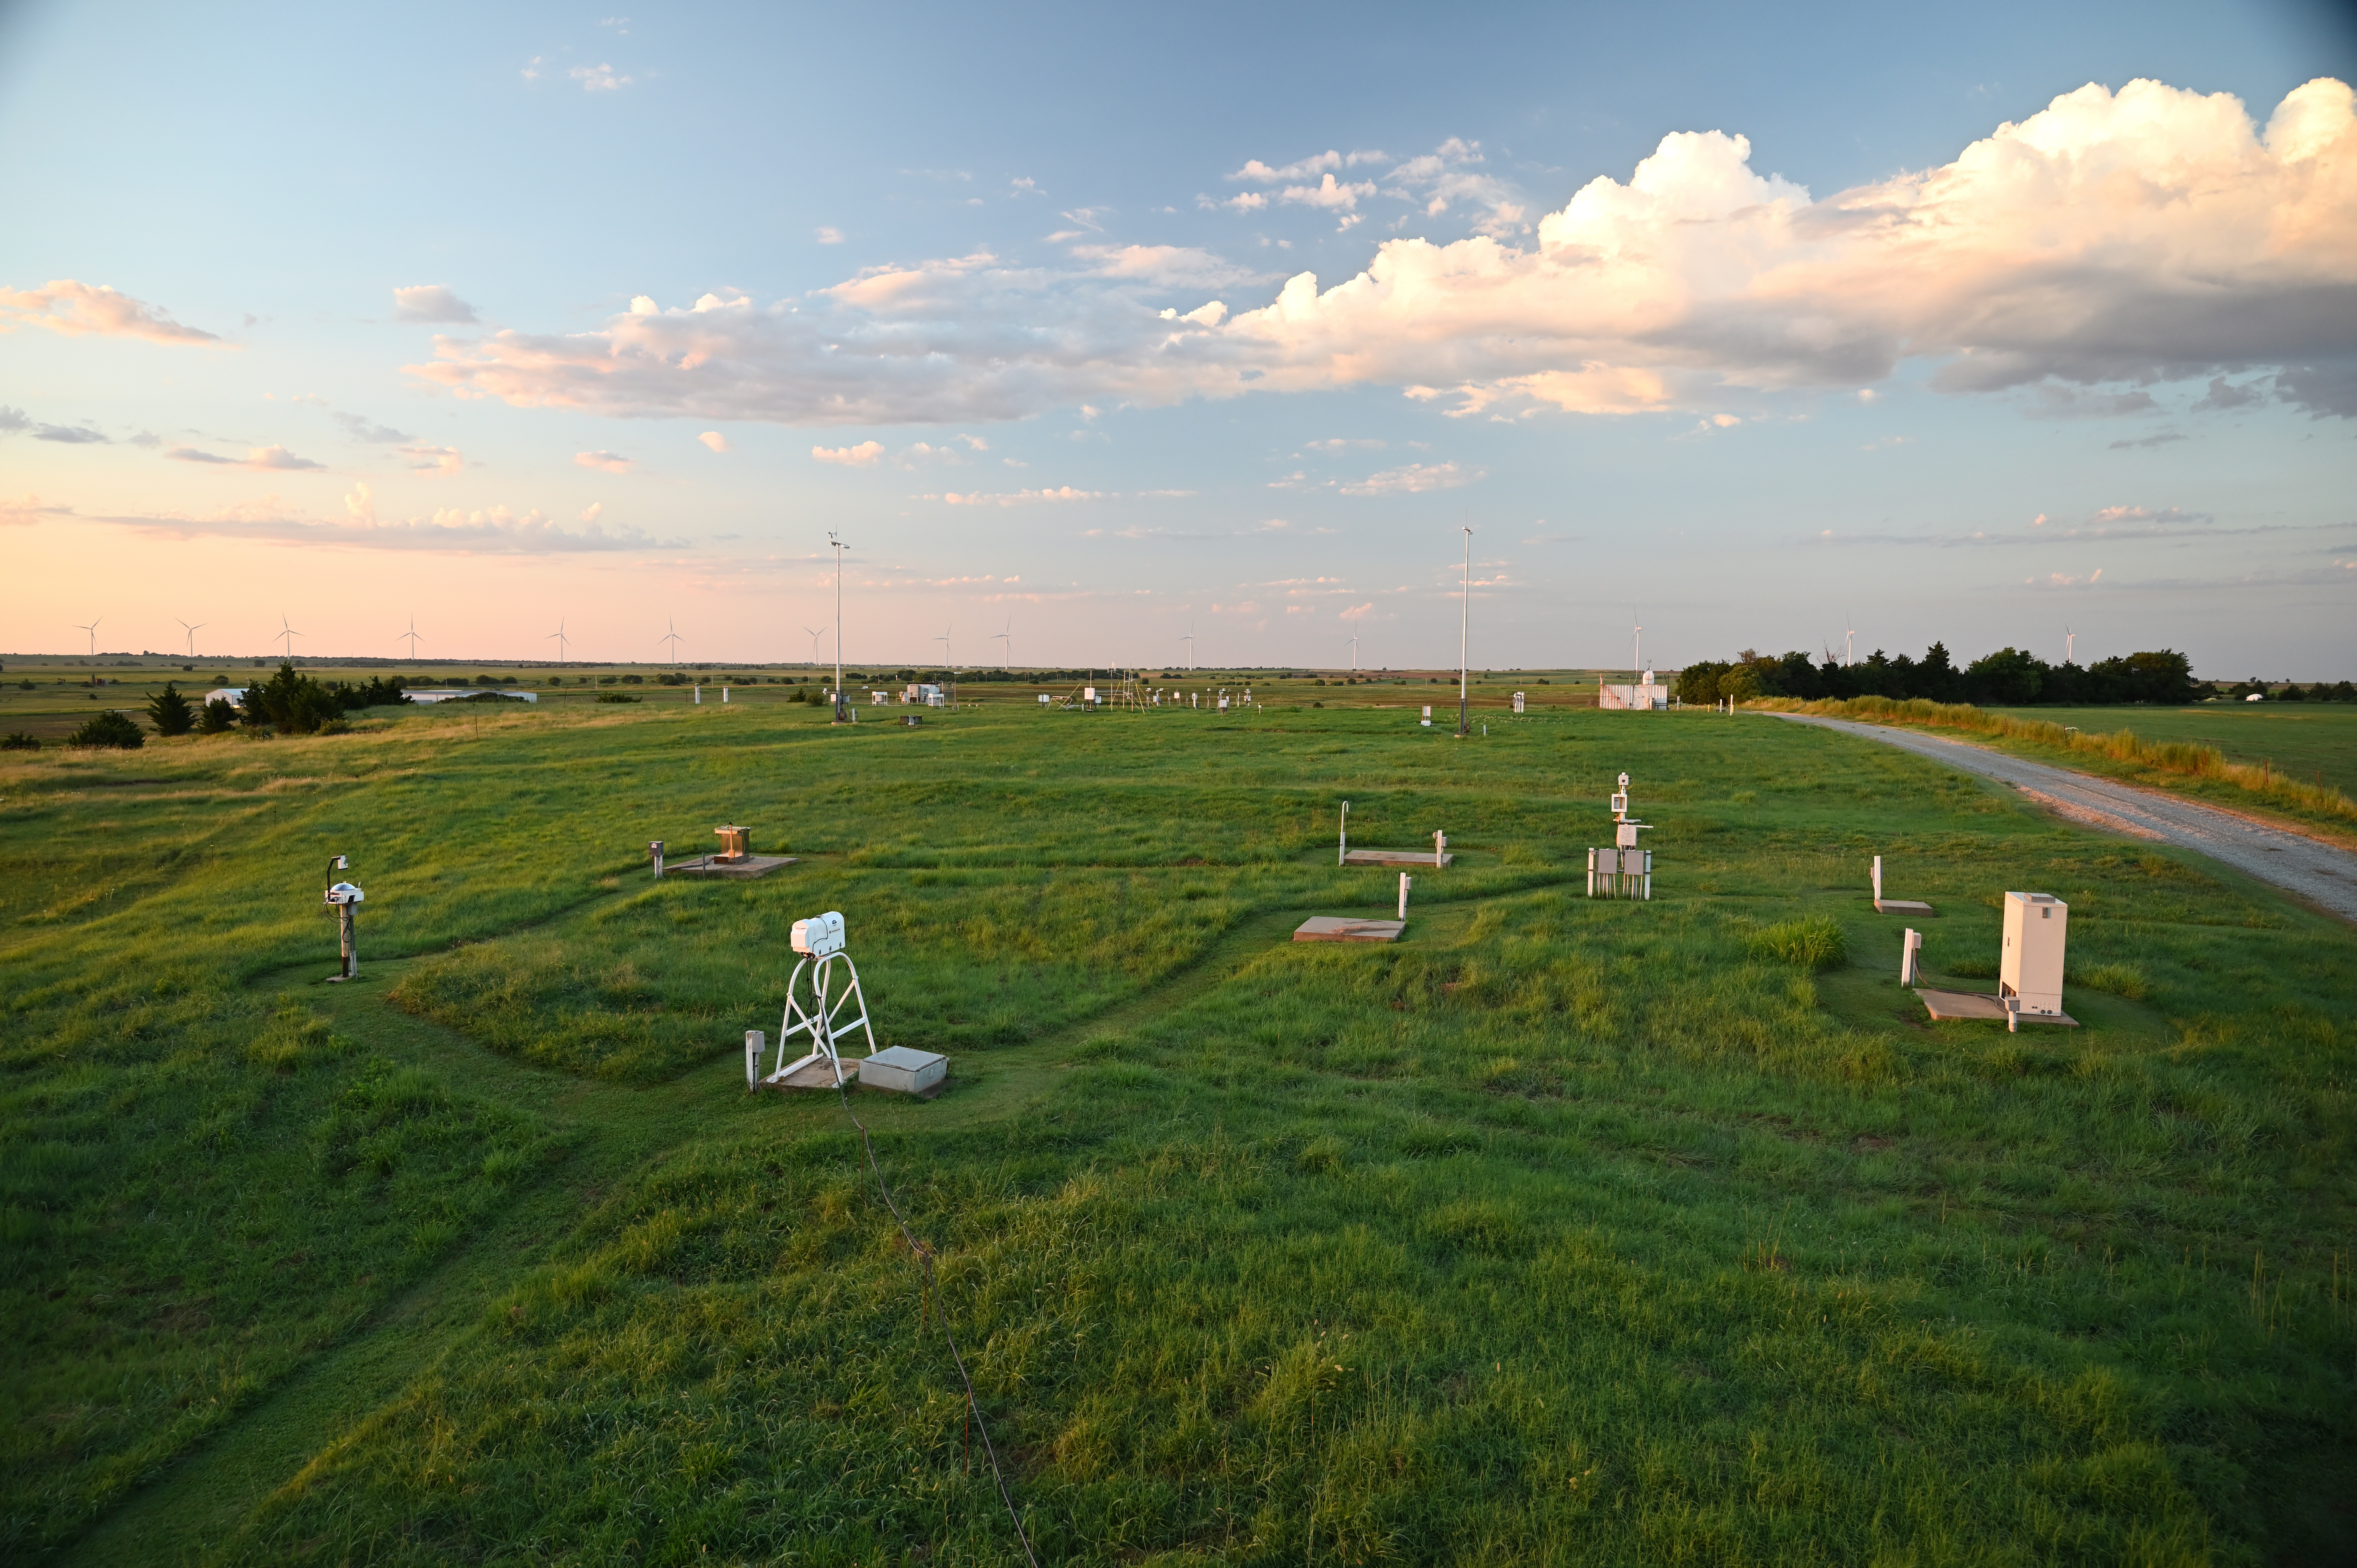
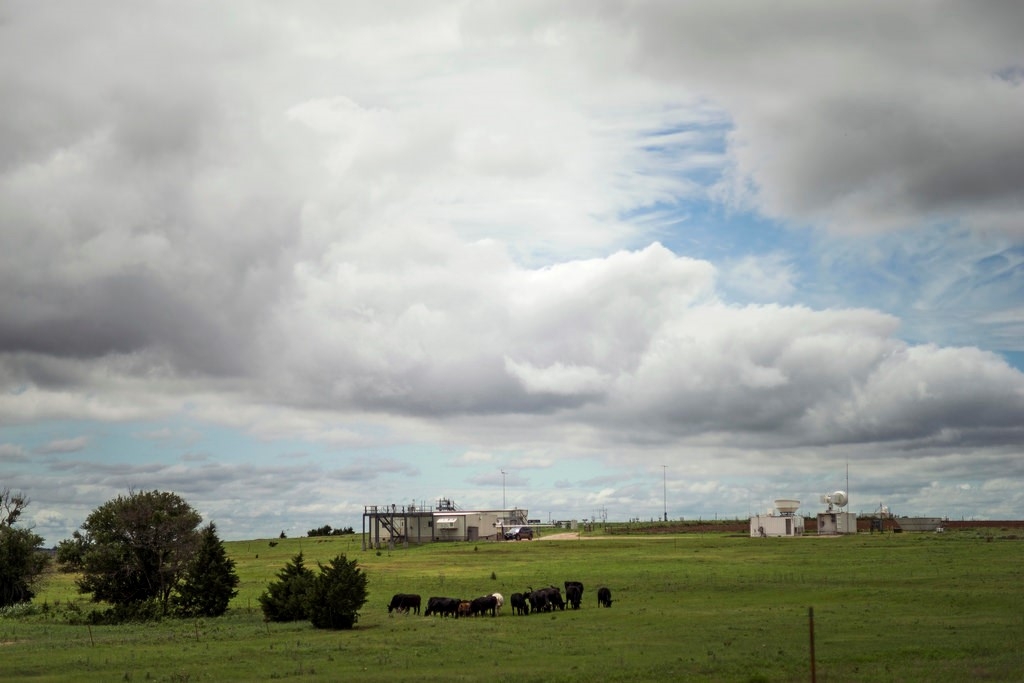
The research drew on data from ARM’s Southern Great Plains (SGP) Central Facility near Lamont, Oklahoma, and two smaller SGP extended facilities in neighboring Oklahoma towns. Newkirk (E33, in SGP nomenclature) experienced wind farm impacts; Omega (E38) did not, as no turbines are close enough.
There are nearly 1,000 turbines within the SGP’s operational area. Those of interest to the Lundquist-Bodini study were built in 2016. One goal of the investigation is to explore if and how this wind development has affected the long-term atmospheric measurements at the SGP. The researchers used data from years before and after the wind farms were built.
Lundquist and Bodini employed mesoscale numerical weather prediction simulations, which showed the largest impacts during stable conditions at night: a slight increase in temperature near the ground and slight cooling effects at altitudes matching the top half of turbine rotors. Wind speeds decreased as far out as 30 kilometers (19 miles), but temperature impacts extended only 5 to 10 kilometers (3 to 6 miles).
Meanwhile, a look at observational data over 17 years, before and after the wind farms, delivered a murkier picture, the authors said. The bottom line is that at the SGP’s Central Facility, no statistically significant impacts on wind speed, temperature, and other factors emerged when comparing conditions before and after the wind farms went into operation.
In the end, the authors called wake effects of wind farms “subtle.”
In part, Lundquist and Bodini did their study as background for the American Wake Experiment (AWAKEN), a 2021–2022 international collaboration to observe and model wake interactions and aerodynamics.
AWAKEN will further the research goals within DOE’s Atmosphere to Electrons (A2e) initiative, a multiyear effort to better understand the complex physics of wind-power generation.
Details are still being ironed out, but a map of AWAKEN instrumentation centers on the SGP.
–Corydon Ireland
The Boundary Layer and Complex Land Surfaces
The spatial heterogeneity—diversity—of the Earth’s surface influences the dynamics of the atmosphere, including its clouds, precipitation, and surface climate.
In earth system models, however, the traditional coupling between land and atmosphere does not reflect a subgrid scale, which could produce biases in how the planetary boundary layer is represented over complex land surfaces.
During a December 16 AGU2020 session on modeling land surface heterogeneity, Meng Huang of Pacific Northwest National Laboratory (PNNL) presented a study on how surface heterogeneity affects the planetary boundary layer. She and her co-authors used DOE’s Energy Exascale Earth System Model (E3SM). (Co-author L. Ruby Leung of PNNL is the E3SM project’s chief scientist.)
For the study, the authors configured E3SM into a single-column model (SCM) based on ARM’s Southern Great Plains (SGP) atmospheric observatory. They fed it the lower boundary-layer conditions derived from the HydroBlocks land surface model, whose subgrid land “tiles” are developed from the repeated, hydrologically similar patterns that exist over a landscape.
Huang and her co-authors designed what she called “two simple experiments” to test the E3SM-SCM scheme. One assumed subgrid surface properties are homogeneous. The second applied data from the new proposed approach, derived from one summer month at the SGP.
A comparison of the two revealed that accounting for land surface heterogeneity enhances turbulent mixing in the boundary layer and raises boundary-layer height. It also increases precipitation and decreases the net cloud radiative effect.
The ultimate goal is to improve the next generation of earth system models. One next step will be to better understand the coupling between the E3SM Land Model and the E3SM Atmosphere Model.
As for the new E3SM-SCM approach, said Huang, “we think it’s worth more study in the future.”
–Corydon Ireland
December 15, 2020
The Influence of Environment on Low-Level Clouds
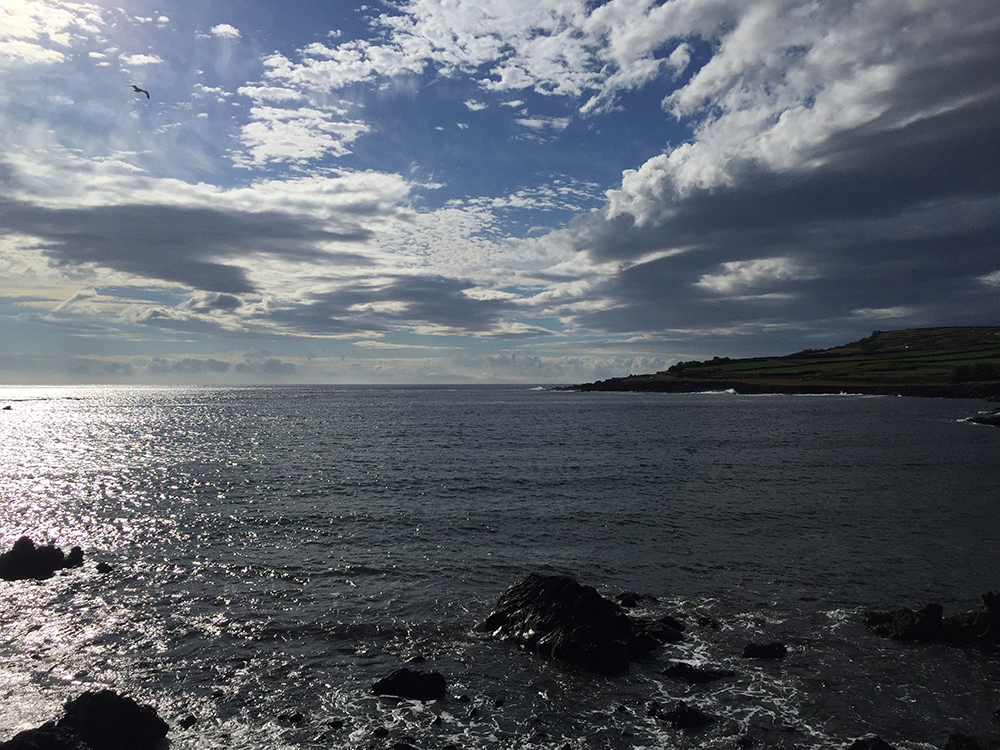
To improve model representations of marine low clouds, which are critical to the global energy balance and water cycle, researchers want to better understand how they are influenced by their environment. In the subtropics, sea surface temperature and stability in the lower levels of the troposphere—the lowest part of the atmosphere—are known to control boundary-layer cloud properties. In the midlatitudes, however, cloud properties might be influenced by different atmospheric dynamics, such as stronger winds.
During a December 15 AGU invited talk, Catherine Naud from Columbia University compared and contrasted relationships between environmental variables and properties of clouds in the Northern and Southern hemispheres.
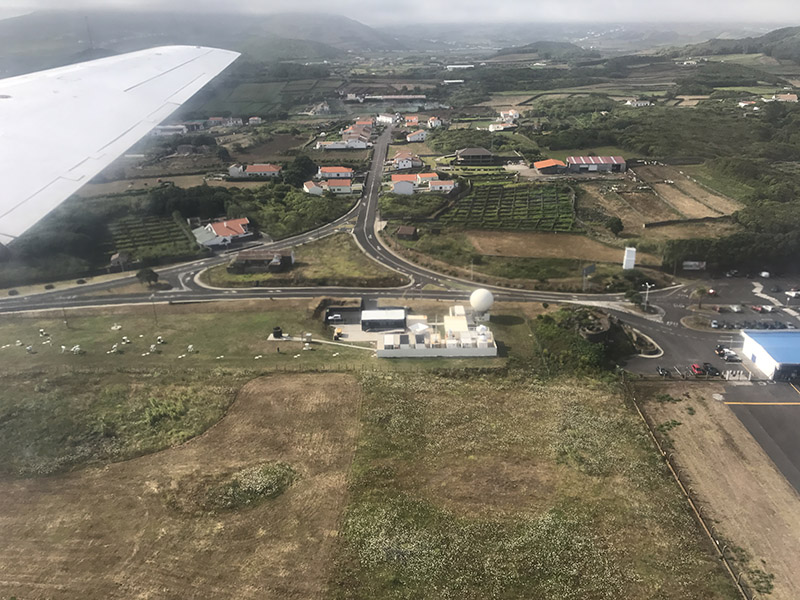
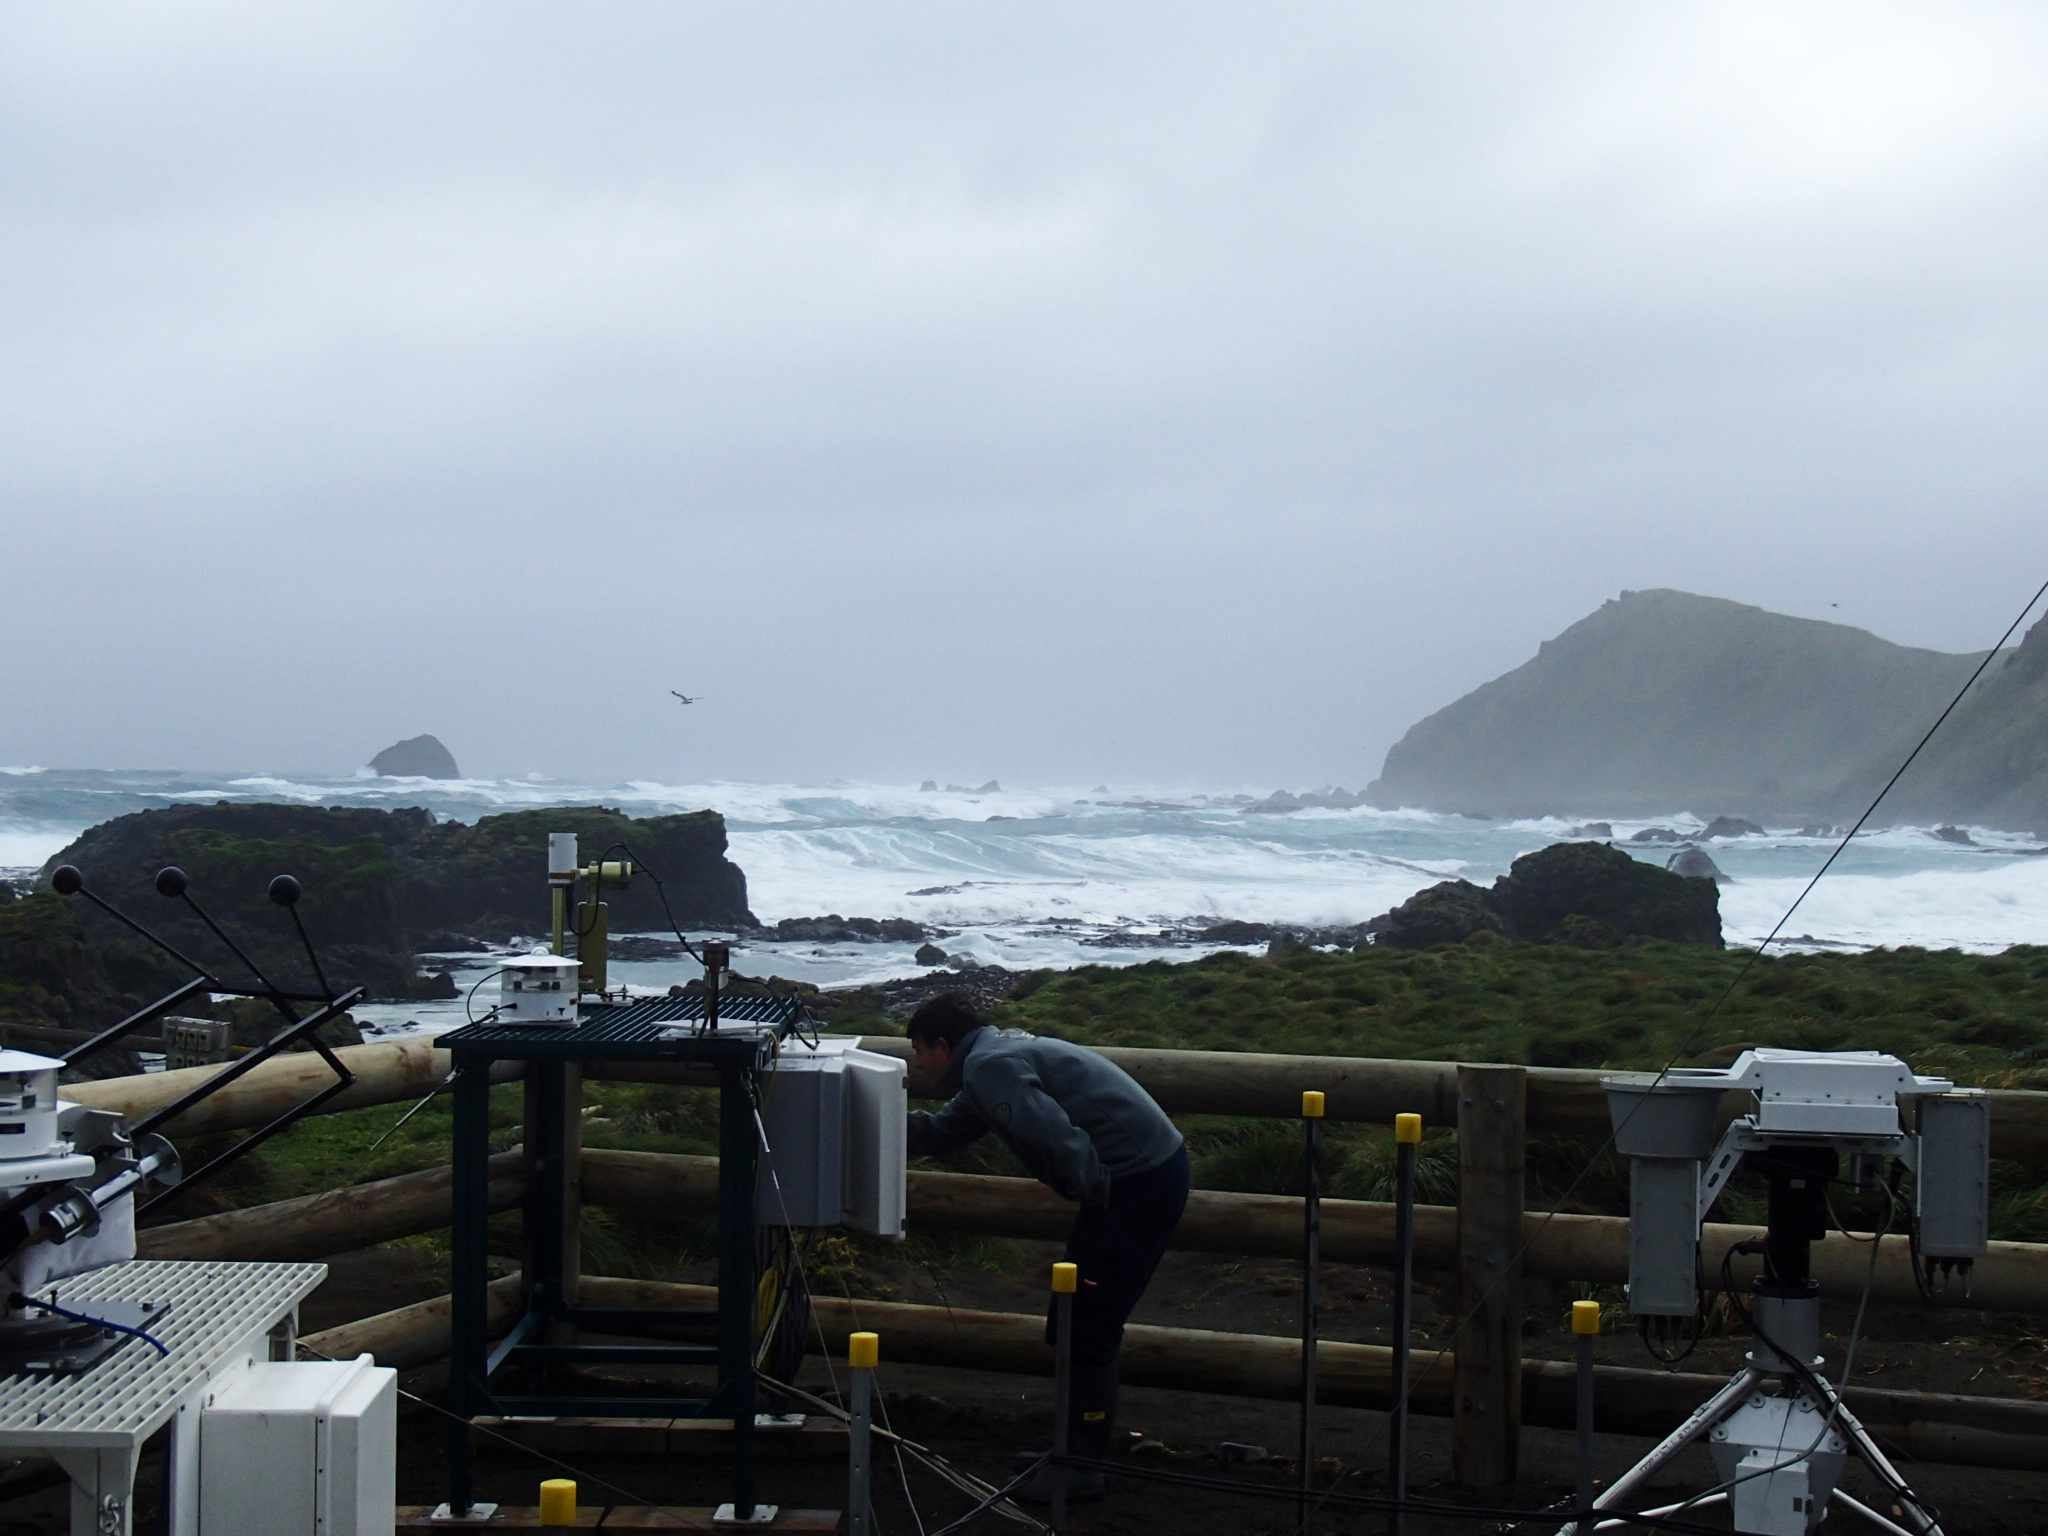
Naud and colleagues used reanalysis information in addition to observations from ARM’s Eastern North Atlantic atmospheric observatory in the Azores and three Southern Ocean field campaigns. This trio of campaigns included two supported by ARM: Measurements of Aerosols, Radiation, and Clouds over the Southern Ocean (MARCUS, 2017–2018) and the Macquarie Island Cloud and Radiation Experiment (MICRE, 2016–2018).
In both hemispheres, said Naud, the researchers found a “clear linear relationship” between cloud base and top heights and a measure of lower tropospheric stability associated with cold-air outbreaks. However, as the abstract noted, the team saw “noticeable differences between the two hemispheres in the overall boundary layer itself, suggesting that other controlling factors might be important in the extratropics.”
To explore these differences, the researchers plan to use satellite-based retrievals such as cloud fraction.
View the abstract and Naud’s full presentation.
–Katie Dorsey
Researchers Put the Pieces of MOSAiC Together
After several days of AGU presentations featuring preliminary results from the Multidisciplinary Drifting Observatory for the Study of Arctic Climate (MOSAiC) expedition, a December 15 press roundtable provided an opportunity for MOSAiC organizers and researchers to share their takeaways from the yearlong research mission in the central Arctic.
Matthew Shupe, MOSAiC co-coordinator and the principal investigator for ARM’s part in the expedition, was a panelist during the roundtable.
Check out ARM’s AGU MOSAiC coverage:
- Data and Impressions From MOSAiC (December 15 roundtable)
- A Blizzard of Posters on MOSAiC Research (December 14 posters)
- Arctic Clouds in the Spotlight (December 14 poster led by Shupe)
- MOSAiC Data Tell Tales of the Arctic (December 11 oral presentations).
–Katie Dorsey
December 14, 2020
Flying High, Long, and Slow
Sharks can fly. Or some of them, at least.
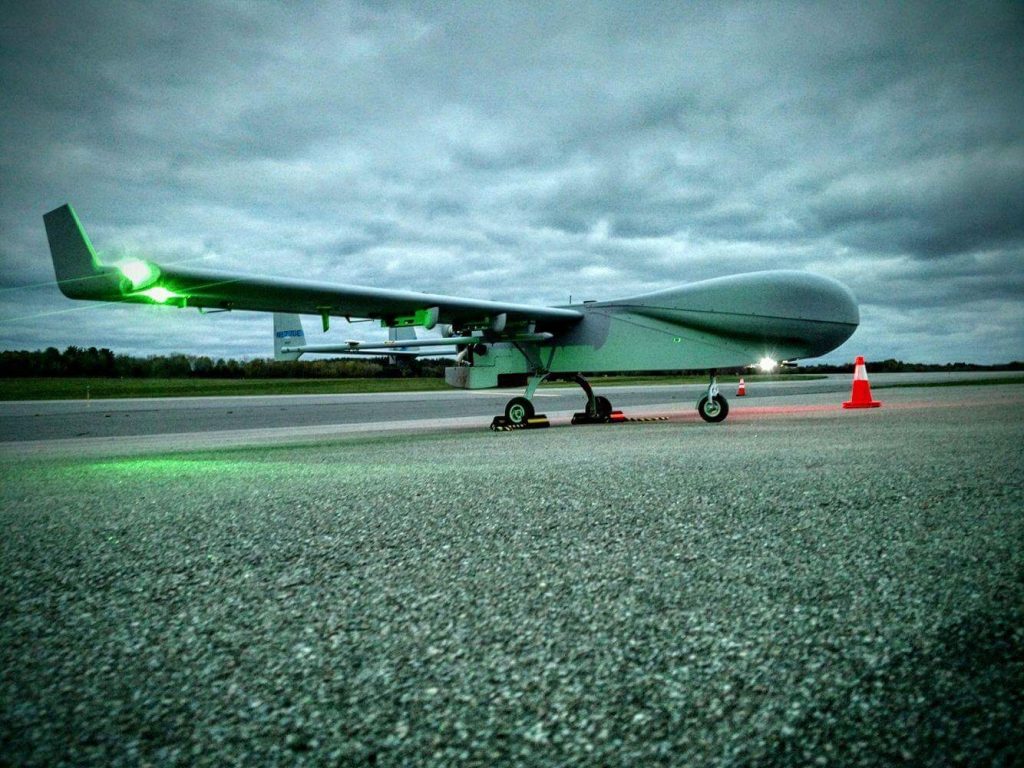
Just ask Beat Schmid, manager of the ARM Aerial Facility. He presented an AGU2020 poster December 14, detailing an unmanned aerial system called the TigerShark Block 3 XP-AR―the “ArcticShark,” in ARM parlance. The remotely piloted aircraft is powered by a single-prop, 60-horsepower rotary engine, has a 22-foot wingspan, and weighs an impressive 649 pounds―about as much as a vending machine.
As an accompanying abstract points out, that’s enough heft and lift capability to carry a 100-pound instrument payload aloft as high as 18,000 feet, over ranges of 310 miles, with a desirably slow typical airspeed of 98 feet per second―a stately 67 mph. That makes slow air sampling possible over wide transects, in contrast to much faster piloted aircraft or high-flying but static tethered balloons.
The ArcticShark, developed and made by Pennsylvania-based Navmar Applied Sciences Corp., is owned by DOE and has been operated by Pacific Northwest National Laboratory since March 2017. It is being developed into an airborne atmospheric research observatory for ARM.
The ArcticShark has an interior payload volume of about 22 gallons and four wing-mounted pylons capable of carrying external probes. So far, ARM provides all the instruments, including those that measure temperature, humidity, pressure, winds, some trace gases, surface temperature, and instruments that do multispectral surface imaging. There are instruments that pull in aerosol data on number concentration, size distribution, absorption, and composition.
The ArcticShark is slated for its first science mission in 2021 at ARM’s Southern Great Plains atmospheric observatory.
A separate experiment, which will include four teams of visual observers, will be done with a similar TigerShark aircraft owned by Mississippi State University.
–Corydon Ireland
Calculating Retrievals and Evaporation Rates During ACE-ENA
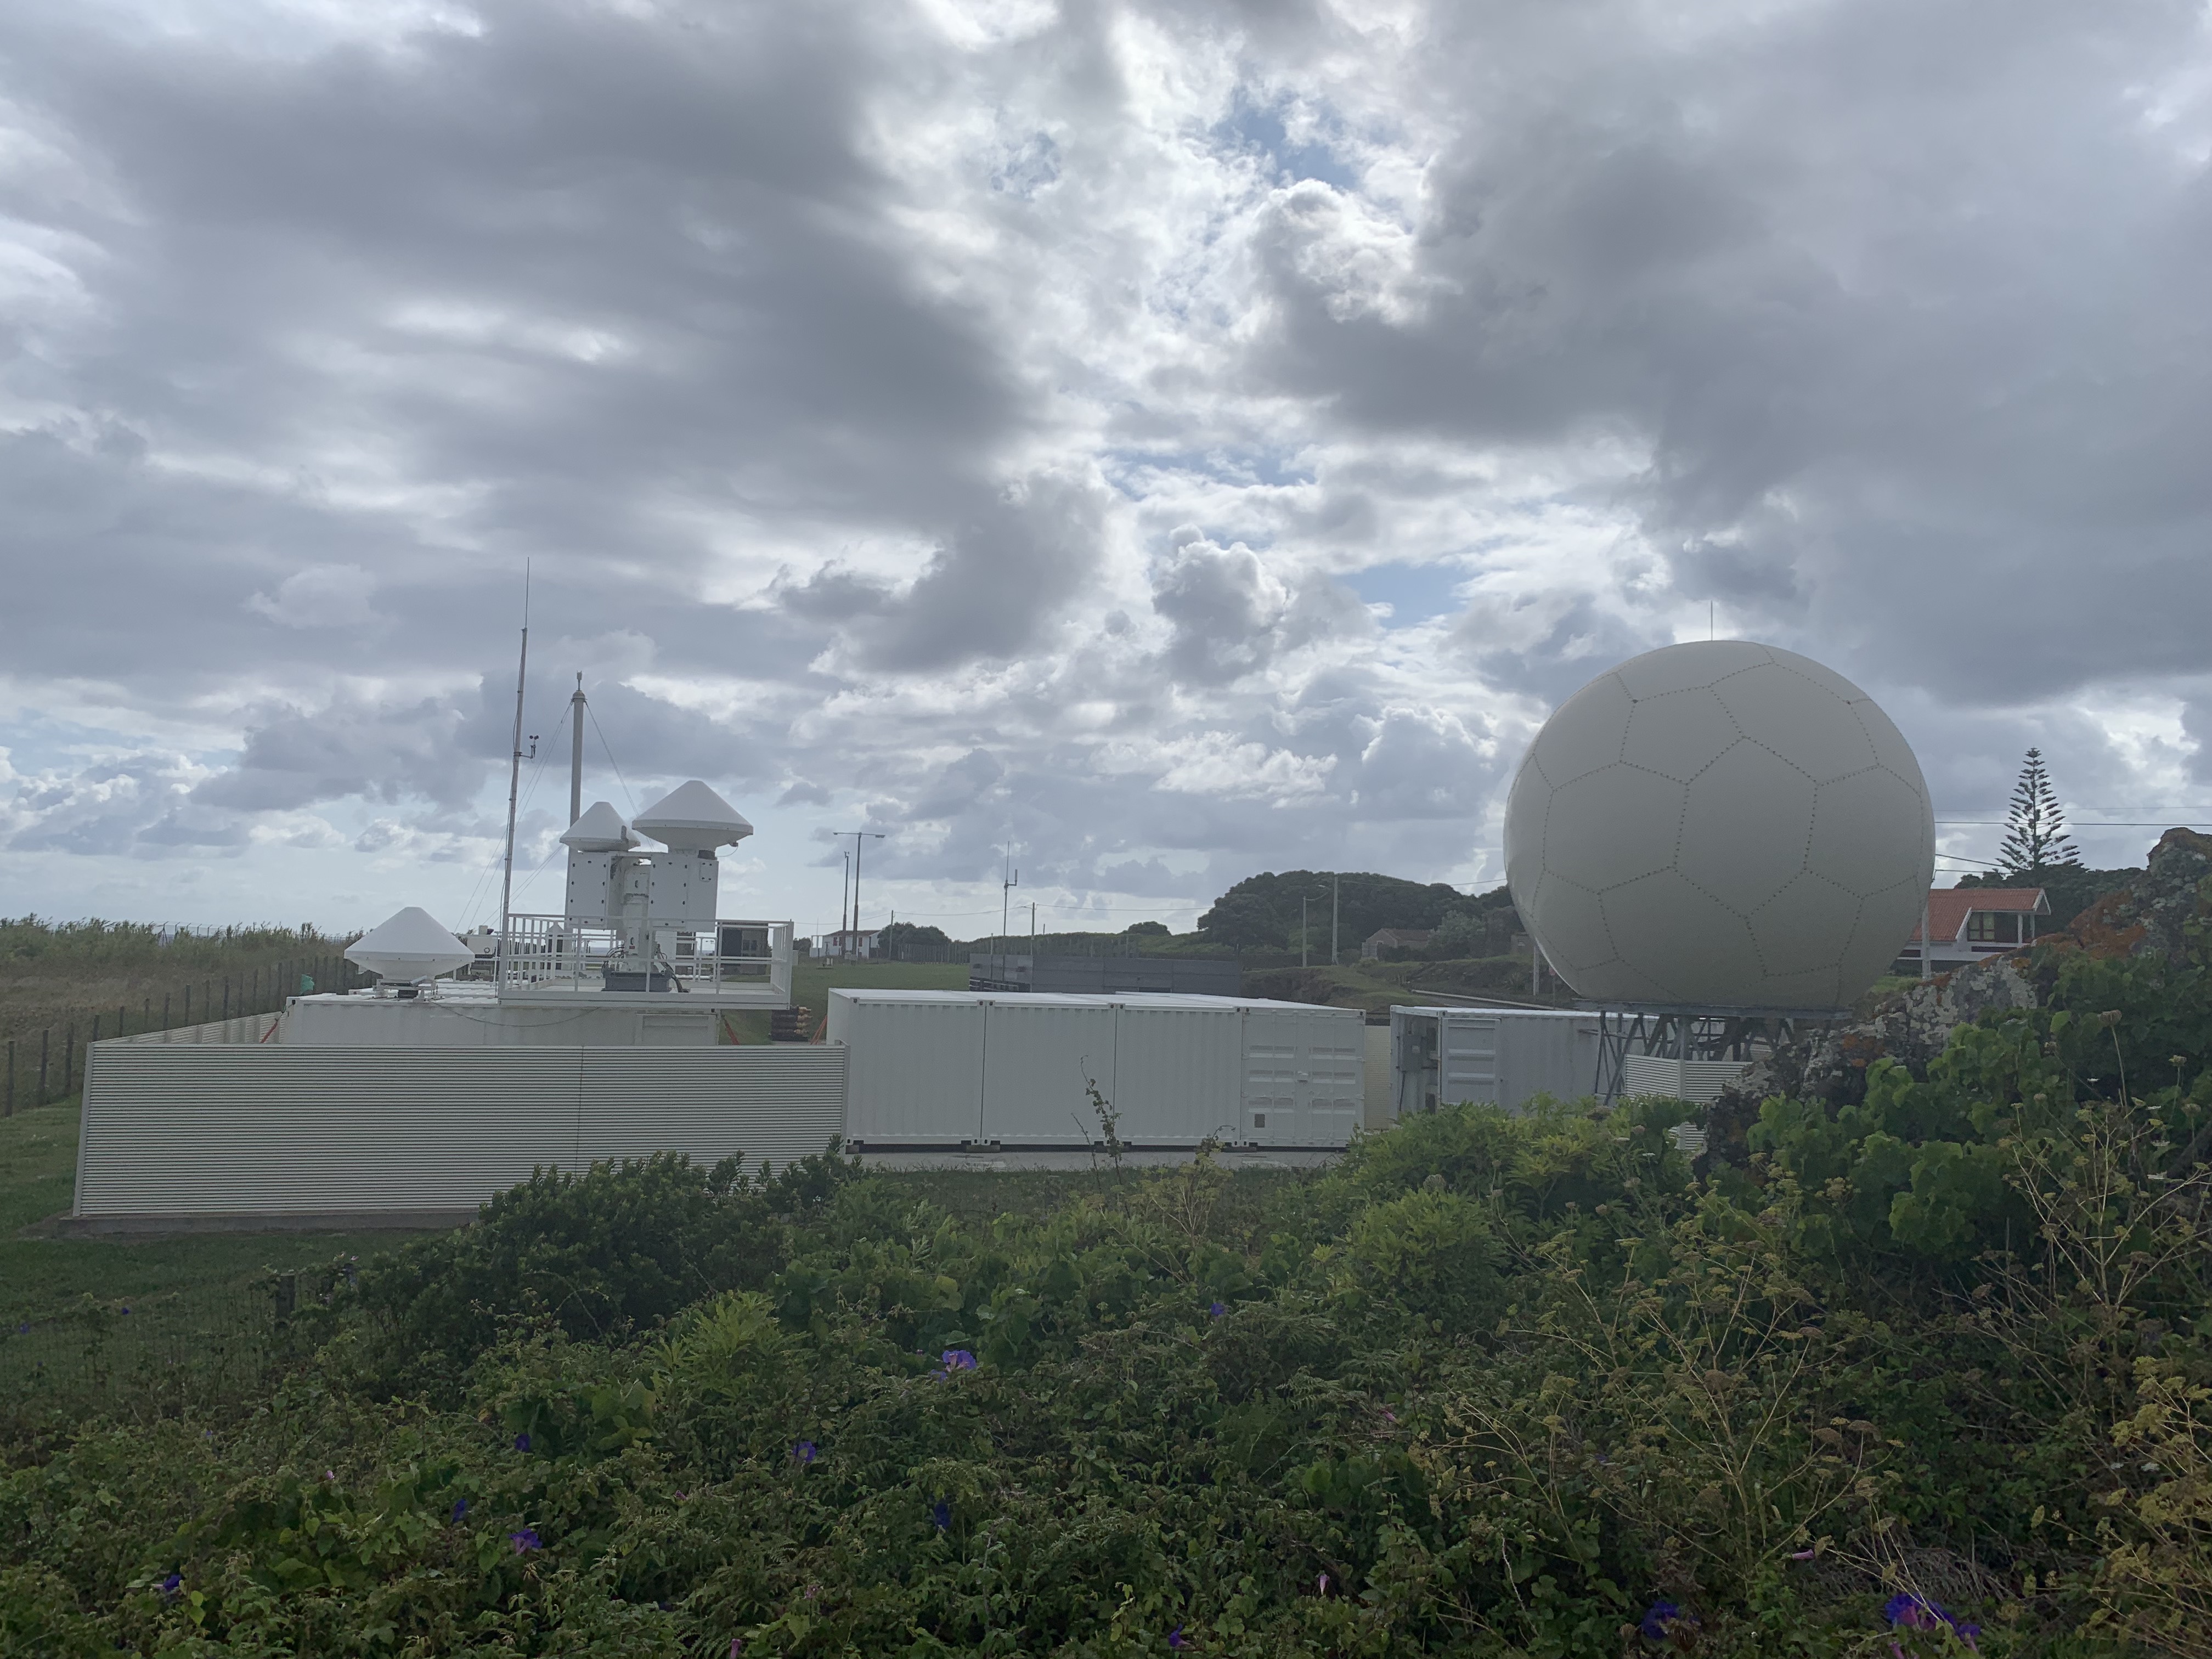
In a December 14 AGU session, Xiquan Dong of the University of Arizona and Qiuxuan Zheng of Rutgers University made separate presentations addressing retrievals during ARM’s Aerosol and Cloud Experiments in the Eastern North Atlantic (ACE-ENA) field campaign. ACE-ENA took place in summer 2017 and winter 2018 in the Azores.
“It is a great challenge to retrieve marine boundary layer (MBL) cloud and drizzle microphysical properties simultaneously,” said Dong. “The first step to address this is to decompose drizzle and cloud reflectivity in MBL clouds from ARM cloud radar reflectivity measurements, and then simultaneously retrieve both cloud and drizzle microphysical properties during the (ACE-ENA) campaign.”
Dong said his team’s findings—validated by aircraft measurements—will provide insights for improving the understanding of warm rain processes and improving model simulations.
Zheng focused on the relationship between reflectivity and summertime rainfall rates during ACE-ENA. Drizzle evaporation, she said, is a chief parameterization that contributes to errors in global earth system models.
Zheng and her colleagues used observations from ARM aircraft, a second-generation Ka-Band ARM Zenith Radar (KAZR2), and a laser ceilometer, which measures cloud height.
“Clouds in this region often undergo a latitudinal transition in morphology from a single cloud layer to complex broken cloud structure that exhibits mesoscale organization,” said Zheng, “and this transition is associated with MBL decoupling and is frequently observed in the wake of cold fronts. Simulations suggest that the cloud transition over the eastern North Atlantic is initiated by increases in surface fluxes and vertical turbulent transports.”
Using ACE-ENA observations and several years of ARM data, researchers calculated rainfall and evaporation rates for four cloud classifications:
- group 1 – single-layer with little drizzle
- group 2 – single-layer with drizzle
- group 3 – multi-layer
- group 4 – broken cells.
“The difference between the four groups is very distinct,” said Zheng, noting that multi-layer clouds have the highest evaporation rates. “Although group 1 and group 4 have low rainfall rates, group 1 are single-layer clouds with the lowest variability and cloud base height, whereas group 4 represents broken cells with the greatest cloud base height variability.”
View the abstracts and presentations for Zheng and Dong.
–Mike Wasem
Snow Dive
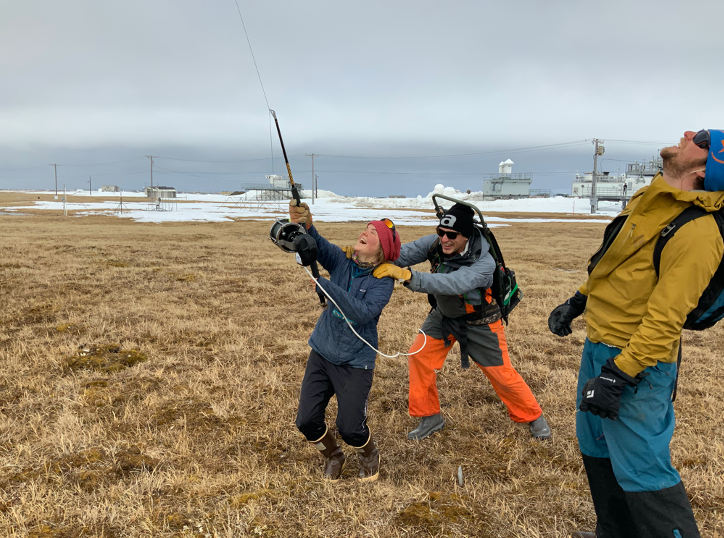
From April through June 2019, ARM supported fieldwork that was part of a three-year study on the evolution of snowmelt and changing surface albedo―reflectivity―funded by DOE’s Atmospheric System Research (ASR).
Within that project is Snow ALbedo eVOlution (SALVO), a 2019–2021 ARM field campaign.
The 2019 fieldwork took place along a 200-meter (656-foot) survey line at ARM’s North Slope of Alaska atmospheric observatory.
As outlined in an AGU2020 poster on December 14, the intent was to measure the evolution of both albedo and the snow melted by warming temperatures―its depth, distribution, stratigraphy, grain character, and other factors.
Researchers performed the same measurements of spatial and temporal snow depletion at two other sites, as outlined in the accompanying abstract. They plan on going out into the field at least one more time during spring to capture data for SALVO and the ASR project.
Changes in albedo drive seasonal snowmelt. Capturing the springtime progression of snowmelt in the high Arctic is critical because land- and sea-surface albedo is an important factor in fine-tuning global earth system models. The 2019 experiment was, as the poster stated, “a deep dive into melting snow” and the speed and spatial extent of such melting matters.
Taking the lead in the poster presentation was University of Alaska, Fairbanks, PhD student Anika Pinzner, who is working on the ASR project with the university’s Matthew Sturm, a veteran snow researcher.
ASR recently profiled Sturm for the snowmelt-evolution project.
–Corydon Ireland
December 11, 2020
Seen and Heard
Notes from the week at AGU:

LEUNG GIVES PRESTIGIOUS LECTURE: L. Ruby Leung, the chief scientist of DOE’s Energy Exascale Earth System Model (E3SM) and a past ARM principal investigator, gave the Jacob Bjerknes Lecture on December 7.
Leung, an atmospheric scientist at Pacific Northwest National Laboratory, was the principal investigator for the 2015 ARM Cloud Aerosol Precipitation Experiment (ACAPEX). She is a fellow of AGU, the American Meteorological Society, and the American Association for the Advancement of Science.
Named for a prominent weather researcher, the Bjerknes Lecture is given annually to a scientist who has done impactful work to advance the understanding of earth systems.
During her lecture, Leung discussed the use of the energetic framework to understand regional precipitation changes and the importance of understanding and modeling convection in advancing that framework.
ICE-NUCLEATING PARTICLES BACK IN SPOTLIGHT: During a December 9 AGU session, two presentations focused on ice-nucleating particles (INPs) collected during ARM field campaigns.
Baptiste Testa of the University of Lyon presented a multi-season study of INP measurements from the Cloud, Aerosol, and Complex Terrain Interactions (CACTI) field campaign in Argentina. CACTI took place from October 2018 through April 2019.
While a seasonal cycle of INP concentrations did not emerge from the sample analysis, said Testa, there were differences in which INPs—biological, organic, and inorganic—dominated in certain temperature ranges.
Peiwen Wang of Stony Brook University shared results of micro-spectroscopic INP analysis of ground and airborne samples from the Aerosol and Cloud Experiments in the Eastern North Atlantic (ACE-ENA) campaign in the Azores. Researchers noted differences between nighttime and daytime samples collected at ARM’s ENA observatory and those between samples collected within the boundary layer and free troposphere. The airborne sampling took place with ARM’s now-retired Gulfstream-159 (G-1) research aircraft.
–Katie Dorsey
Radiosonde Data Give Insights Into Convective Systems
Mesoscale convective systems (MCSs) are organized groups of intense thunderstorms that usually last several hours. To understand the space and time evolution of environments that spawn MCSs, among other questions, researchers are turning to data from radiosonde launches.
In his December 11 AGU invited talk, Russ Schumacher of Colorado State University discussed high-frequency radiosonde findings from the 2018–2019 RELAMPAGO-CACTI collaboration in Argentina and the 2015 Plains Elevated Convection at Night (PECAN) campaign. ARM’s Southern Great Plains atmospheric observatory was among the research sites for PECAN.
PECAN radiosonde data provided a look at environmental conditions before and after convection. Analyzing the data, researchers grouped soundings from preconvective MCS cases into three main clusters. One cluster was more characteristic of typical nighttime MCS environments, with a stable layer at the surface, atmospheric (elevated) instability, and a low-level jet. However, the other two clusters—lacking low-level stability—were more representative of daytime soundings.
RELAMPAGO radiosonde observations from a multi-day elevated MCS in November 2018 showed the presence of surface stability, instability above the stable layer, and a strong low-level jet. Schumacher said researchers were surprised to find that the South American low-level jet was much higher than what is typically seen in the U.S. Great Plains.
–Katie Dorsey
December 10, 2020
Night and Day: Convective Cell Findings From CACTI
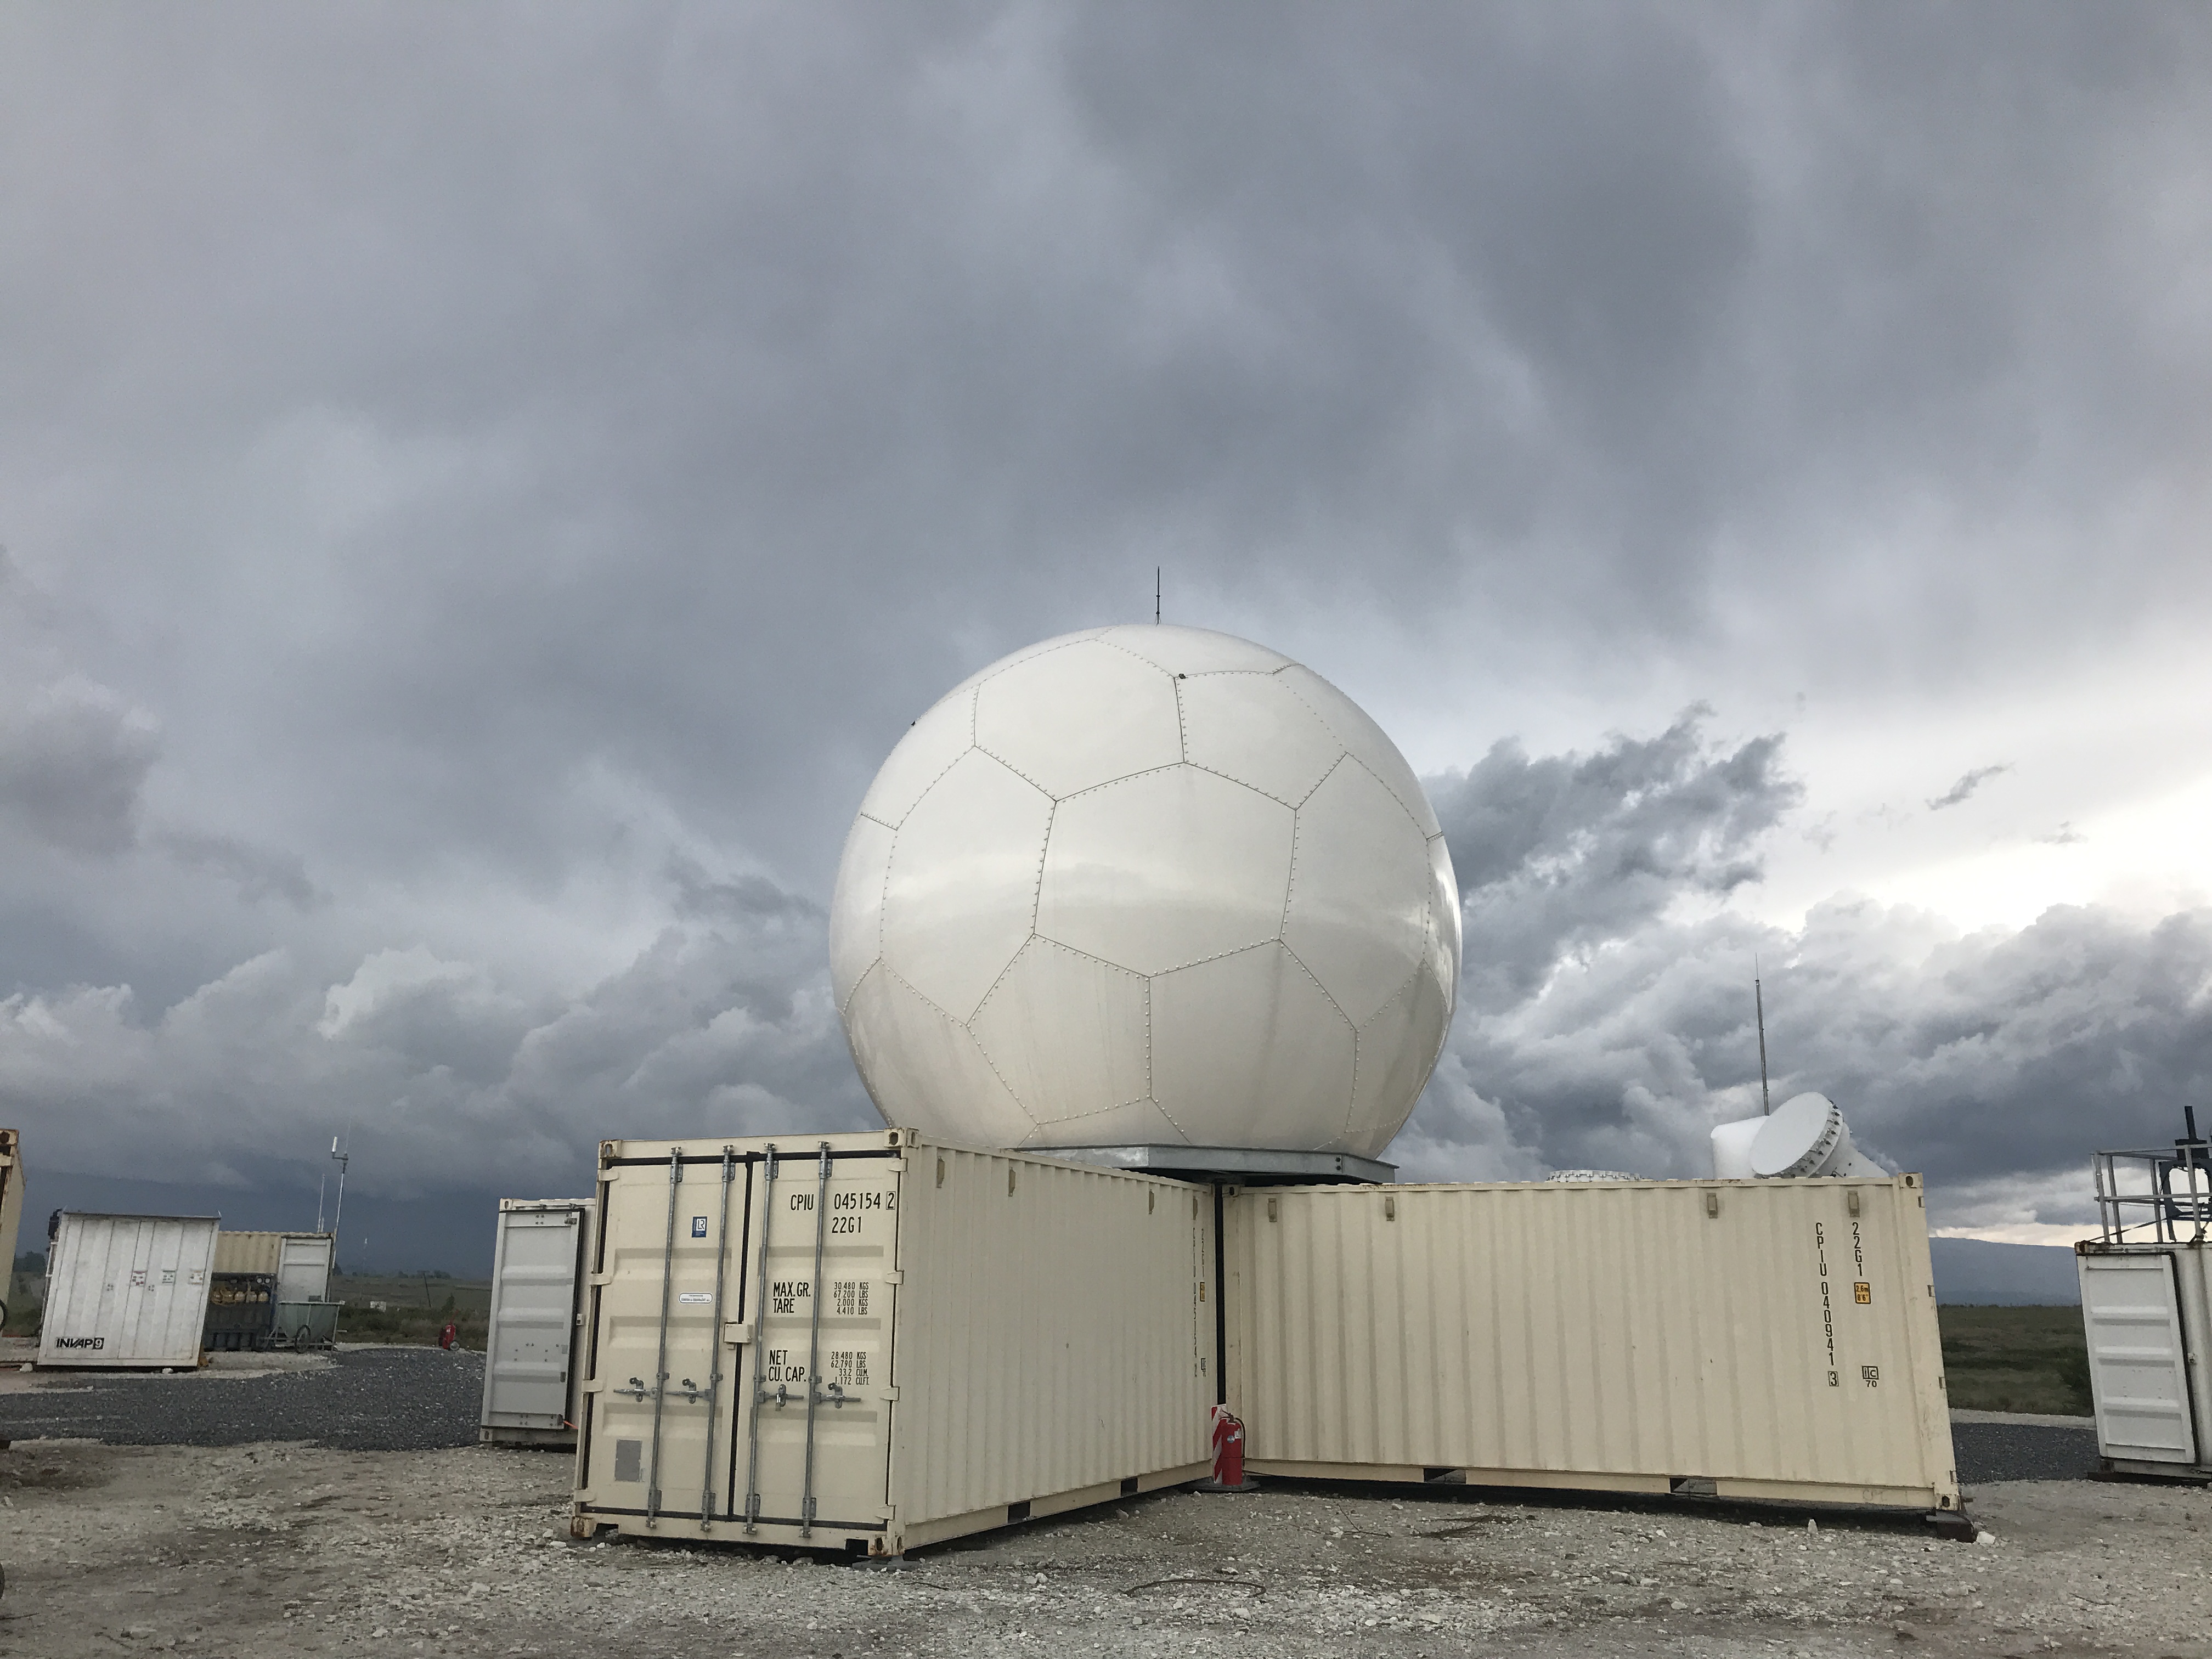
The world’s largest thunderstorms occur in the Sierras de Córdoba mountain range of central Argentina. According to data from ARM’s recent Cloud, Aerosol, and Complex Terrain Interactions (CACTI) field campaign, the time of day seems to be a factor in when and where convective cells form in the region.
At AGU on December 10, CACTI Principal Investigator Adam Varble shared that researchers are building a database chronicling 6,857 convective cells tracked during CACTI using the second-generation C-Band Scanning ARM Precipitation Radar (CSAPR2). Associated cloud, precipitation, and environmental properties are available for each cell.
Data from the tracked cells showed cell formation to be trimodal—peaking at three different times (1–2 a.m., 8–9 a.m., and 2–3 p.m.).
Varble, a scientist at Pacific Northwest National Laboratory, said that surface heating is the probable cause of the afternoon peak and the overnight peak is likely tied to nocturnal mesoscale convective systems. Researchers are investigating what might be responsible for the 8–9 a.m. peak.
Another finding that piqued the team’s curiosity was a peak in overnight convective cell formation along the western slope of the mountains. During the day, said Varble, convective cells usually form on the eastern side—a likely result of daytime heating and upslope winds.
View Varble’s abstract and full presentation, including findings on cell reflectivity.
Other CACTI research was featured during a December 10 AGU poster session. Two companion posters used radiosonde data and large-eddy simulations to look at environmental conditions that support storm formation (see the posters here and here). The other poster provided insights into periods of warm shallow clouds identified through the use of a cloud type classification algorithm.
–Katie Dorsey
A Rural Diversity of Ice-Nucleating Particles
Terrestrial environments contribute natural aerosols to the atmosphere in the form of pollen, plant-tissue dandruff, soil organic matter, minerals, fungal spores, and bacteria. Ocean environments emit their own unique aerosol cocktails. Both vast sources informed presentations during a December 10 AGU session on natural aerosols.
One contributor was Tom Hill, an environmental microbiologist at Colorado State University whose specialty is biogenic aerosols. In the spring of 2020, ARM named Hill and university colleague Jessie Creamean lead mentors in the user facility’s expanded effort to collect and analyze ice-nucleating particles (INPs). (Creamean was a co-author of Hill’s AGU2020 presentation.)
INPs are tiny particles swept into the atmosphere, where they trigger the freezing of supercooled cloud droplets. That initiates precipitation and influences cloud reflectivity and life span, making these tiny bits of bacteria, fungi, and other organic matter big players in the planet’s water cycle.
“INPs are rare, really rare, in the atmosphere,” said Hill in a “poster walk” of flash talks that accompanied the session. “But they really pack a punch.”
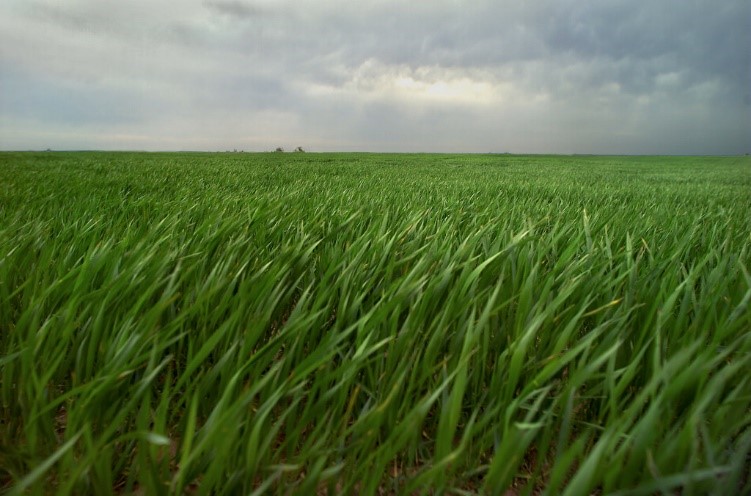
Agricultural landscapes, the subject of the video-augmented Hill-Creamean poster (with other authors), represent a “vast source of highly diverse INPs,” said Hill.
At minus 10 degrees Celsius, arable soils may contain 100 million INPs per gram. Crops such as wheat can release 1 million or more INPs per gram of leaf.
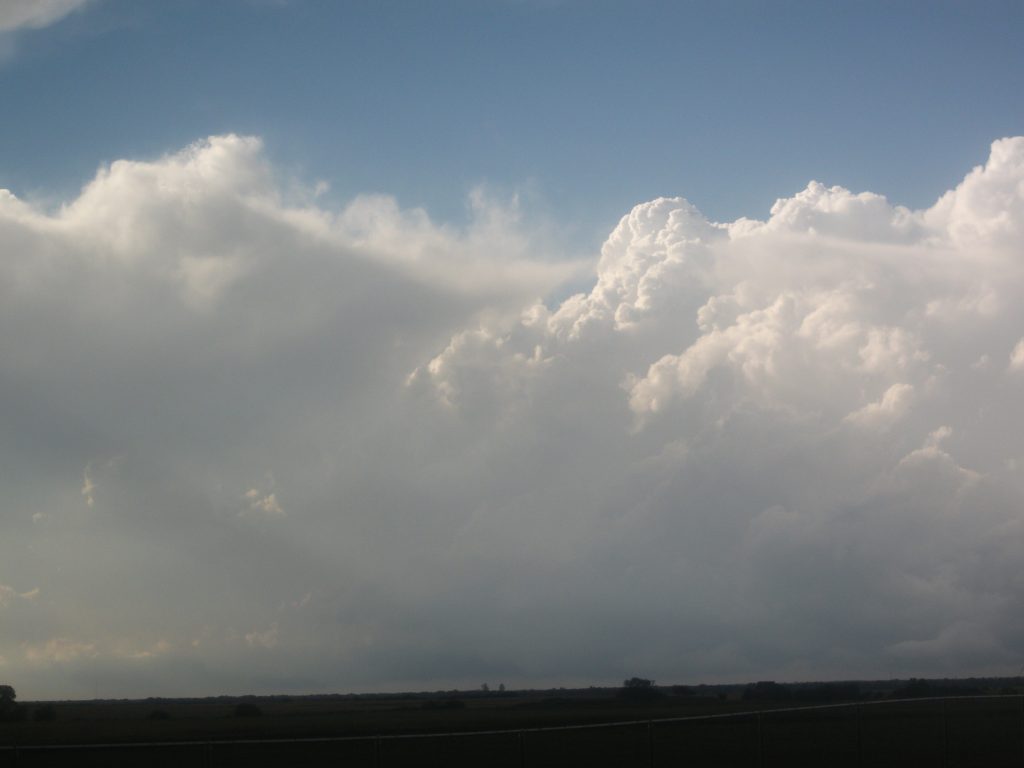
The most active INPs from agricultural sources are mainly biogenic, Hill pointed out. They are bounced into the air by wind, rainfall, tillage, or other surface disturbances.
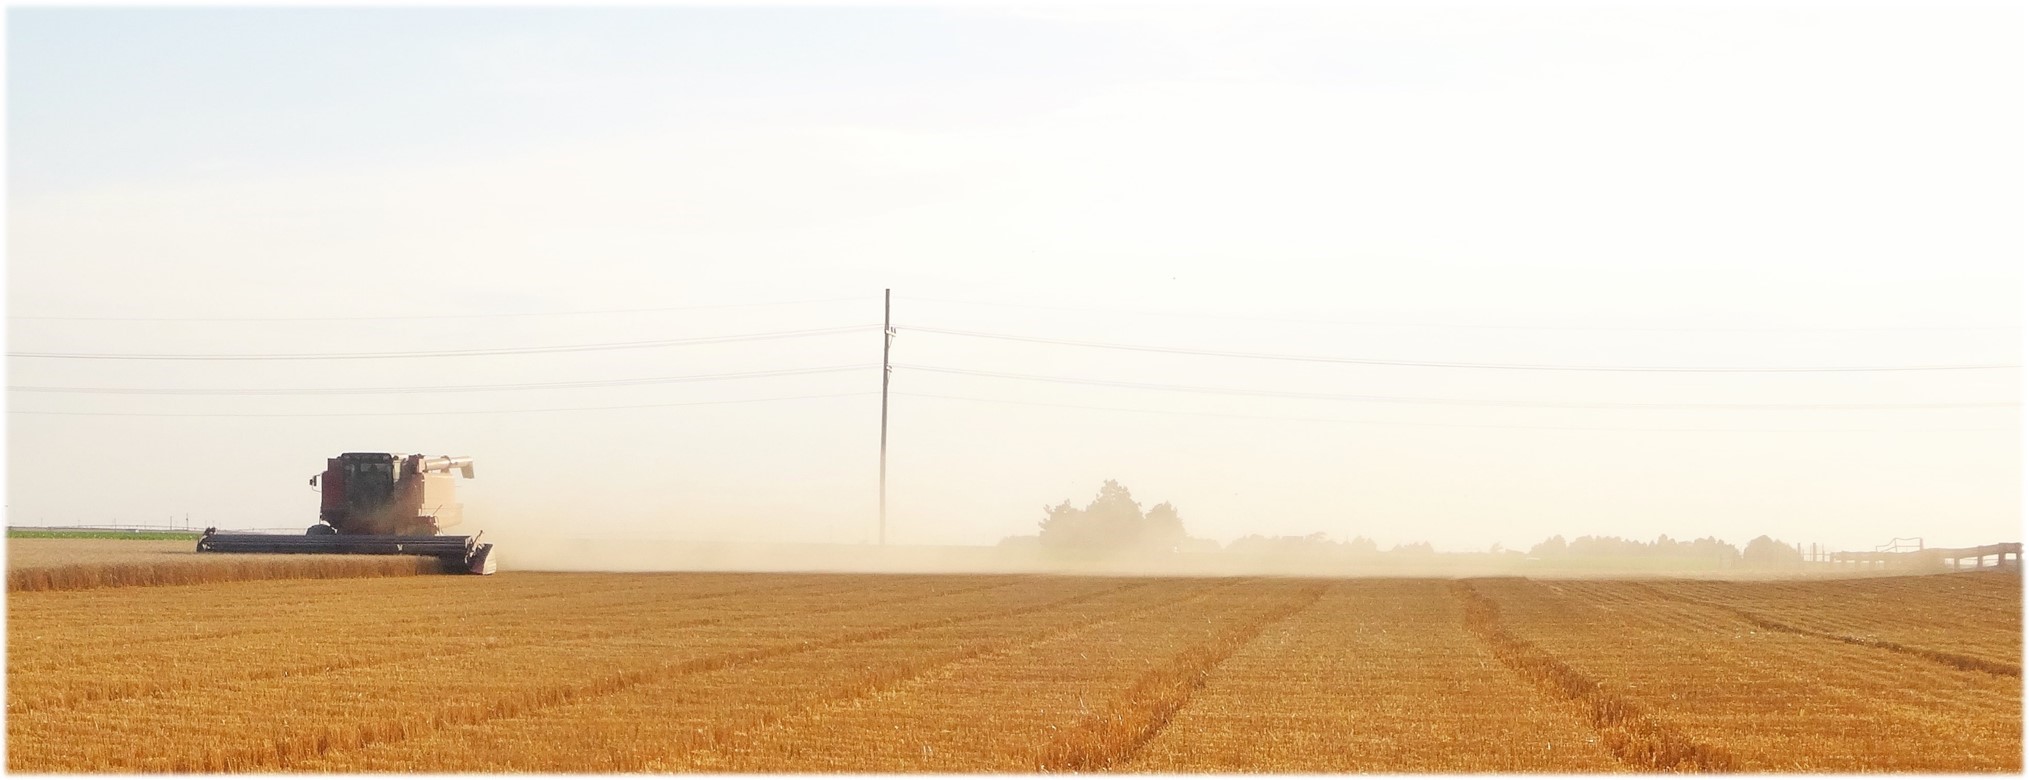
For a series of National Science Foundation field experiments in 2014 and 2015, summarized on the poster, Hill and Colorado State collaborators set up an aerosol sampling platform at the edge of a wheat field in Colby, Kansas.
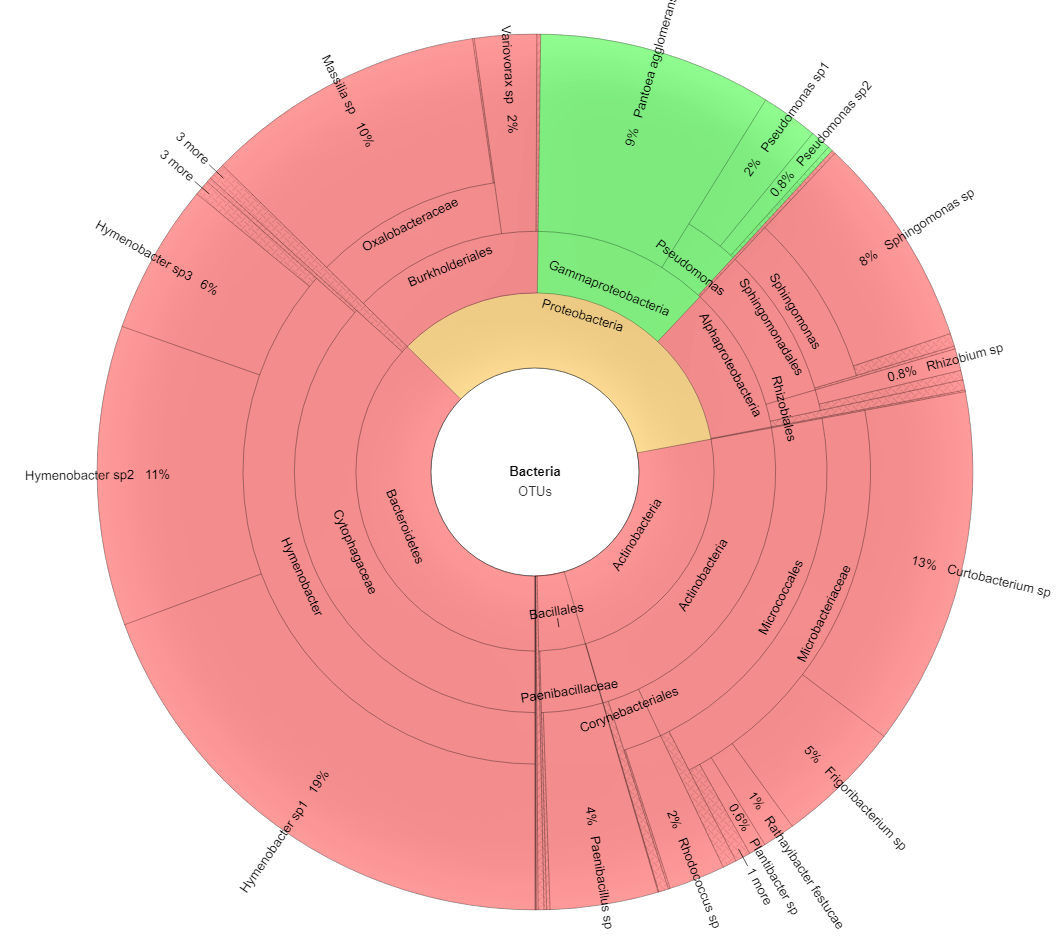
They deployed a continuous flow diffusion chamber rigged into a specialized mobile laboratory. For analysis, they nabbed samples of air laden with INPs downwind of combine harvesting―then used the same samples to profile the bacterial diversity of wheat-harvest aerosol.
The main aim of the project was to characterize the number, nature, and diversity of INPs. For instance, only certain genera of bacteria, along with an increasing list of fungi, are known to contain species or strains active for ice nucleation.
Hill was on a large team that carried out similar work during the Aerosol-Ice Formation Closure Pilot Study, a three-week sampling experiment in October 2019 at ARM’s Southern Great Plains (SGP) atmospheric observatory.
In Kansas and at the SGP, he and the university aerosol group, led by Sonia Kreidenweis and Paul DeMott, used many techniques, including real-time sampling, offline measures of INPs, physicochemical tests, and DNA profiling.
In the end, the idea is to classify atmospheric INPs into characteristic populations―then link those populations back to landscapes, weather, and agricultural practices.
Hill called the poster a glimpse at the “multifactorial process needed to tie what we find in the air to what’s coming off the ground.”
–Corydon Ireland
December 9, 2020
Taking Machine Learning to the Atmosphere
How can recent breakthroughs in machine learning and artificial intelligence help our understanding of earth system models? In particular, how can these tools improve the models we have for atmospheric aerosols, clouds, and radiation?
These questions were addressed through 10 papers presented as posters during a AGU2020 session December 9, often with a focus on machine learning and aerosols.
Aerosols are tiny solid and liquid particles in the air that influence cloud formation and precipitation. They inhabit the atmosphere in countless trillions, with masses and shapes and surface chemistries as individual as snowflakes.
Among the December 9 presentations was a machine learning-aided investigation of cloud condensation nuclei (CCN) number by Arshad Arjunan Nair and Fangqun Yu at the State University of New York at Albany. Concentrations of CCN deeply influence aerosol-cloud interactions and subsequent climate effects, yet their measurements are sparse. This gap contributes to large uncertainties in models of global earth system change.
To help fill in that gap, Nair and Yu use a machine learning tool called random decision forests to develop a Random Forest Regression Model (RFRM) to derive CCN. They modified, optimized, and retrained the RFRM to make predictions based on long-term measurements at ARM’s Southern Great Plains atmospheric observatory.
Nair and Yu say their work, outlined in an accompanying poster, shows the potential of a machine learning technique as an option in earth system models.
–Corydon Ireland
Jolly Good AGU Fellows
Two members of the ARM/Atmospheric System Research (ASR) community—Greg McFarquhar and William D. Collins—were among 62 scientists selected as 2020 AGU Fellows.
McFarquhar and Collins, recognized during AGU’s Honors Showcase on December 9, have entered rarefied air: AGU limits fellows to 0.1 percent of its membership each year.

McFarquhar, director of the Cooperative Institute for Mesoscale Meteorological Studies and a professor in the School of Meteorology at the University of Oklahoma, has been an ASR-funded principal or co-investigator on numerous ARM campaigns. More recently, he was the principal investigator for the 2017–2018 Measurements of Aerosols, Radiation, and Clouds over the Southern Ocean (MARCUS) field campaign.
AGU recognized McFarquhar “for fundamental advances in the understanding of cloud properties and processes, leading to their improved representation in weather and climate models.”
In a video shared on the AGU website, McFarquhar said that many of the ideas for his campaigns and papers “have originated from discussions that have taken place at AGU.”
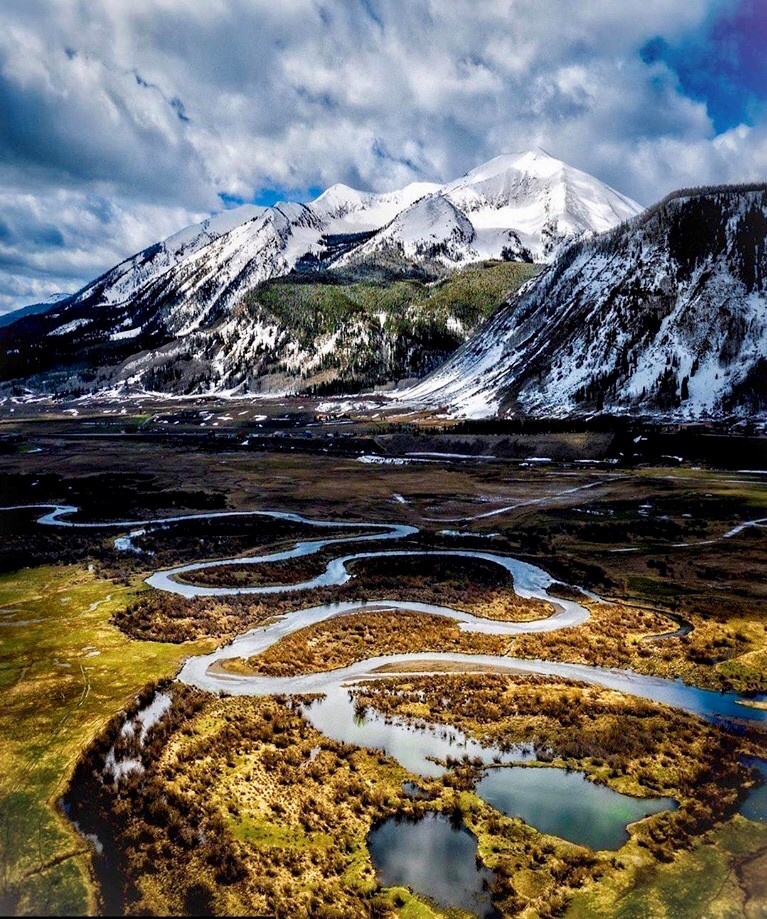
Collins is the director of Lawrence Berkeley National Laboratory’s Climate and Ecosystem Sciences Division and a professor in residence at the University of California, Berkeley. He is a co-investigator on ARM’s upcoming Surface Atmosphere Integrated Field Laboratory (SAIL) field campaign in Colorado.
Collins’ AGU Fellow page cited his “pioneering contributions to the fundamental understanding of atmospheric radiation, radiative forcing, and the role of radiation in climate.” In 2015, Collins received a DOE Secretarial Honor Award as chief scientist of the Accelerated Climate Modeling for Energy (ACME) project. From 2003 to 2005, he chaired the DOE/National Science Foundation Community Climate System Model Scientific Steering Committee.
“I very much look forward to continuing to tackle the critical issues around climate change with all the AGU membership in years to come,” said Collins in his acceptance video.
–Katie Dorsey
Entering New Frontiers of Atmospheric Science
Pavlos Kollias, a former ARM associate chief scientist, knows the power of ground-based observatories equipped to gather information on clouds and precipitation. But instruments are limited in what they can observe. For instance, vertically pointing radars can see a cloud passing above them but cannot capture its properties before or after it moves overhead. And, as researchers know all too well, it takes time to make sense of what data from individual sensors mean together.

During a special AGU session December 9, Kollias presented what he called a “new paradigm shift on how to conduct observations.” Kollias described a framework developed over the last year and a half in which active remote sensors, such as radars, are driven by satellite, camera, and other non-radar observations to track atmospheric phenomena in real time with unprecedented resolution.
“Doing that,” said Kollias of applying the new Multisensor Agile Adaptive Sampling framework, “we were able to get the first automated life cycle of shallow cumulus clouds, and that opens the door for doing it in a larger perspective.”

The talk was part of the Frontiers of Atmospheric Science I session, which highlighted the work of 2020 AGU Atmospheric Sciences Ascent Award (midcareer) and James R. Holton Award (early career) recipients.
Presented annually to scientists eight to 20 years removed from receiving their PhDs, the Ascent awards recognize honorees for their influential research and scientific leadership.
Kollias, a professor at Stony Brook University and an atmospheric scientist at Brookhaven National Laboratory in New York, was one of five Ascent award winners this year.
Recent Atmospheric System Research (ASR) co-investigator Tristan L’Ecuyer, also a 2020 Ascent honoree, presented on what active sensors in space, such as NASA’s CloudSat satellite, have taught researchers about Earth’s energy balance. L’Ecuyer is the director of the Cooperative Institute for Meteorological Satellite Studies at the University of Wisconsin, Madison.
L’Ecuyer said that mixed-phase clouds make up less than 8% of total global cloud cover but account for 20% of the net global cloud radiative effect at both the top of the atmosphere and the surface.
“We’ve also been able to show that clouds enhance Greenland ice sheet melt by up to 50 gigatons per year, and about half of that melt comes from supercooled water contained in mixed-phase clouds,” said L’Ecuyer.
From 2016 to 2018, L’Ecuyer was an ASR co-investigator on a project to develop and evaluate a data product for cold cloud and precipitation process analyses using observations from ARM’s Alaska sites.
–Katie Dorsey
Modeling the Transport of Soil Dusts Into the Atmosphere
Over land or ocean, the planetary boundary layer is where air motion is most influenced by the Earth’s surface. Atmospheric turbulence in this layer causes vertical exchanges of heat, moisture, mass, and momentum in a realm whose dynamism drives cloud formation, chemical mixing, long-distance transport, and other processes that influence weather, climate, ecosystems, and the environment.
The boundary layer, with its complex processes and turbulence, was the subject of an AGU2020 poster session on December 9. Among the 17 papers presented in graphical form was one by two researchers at Pacific Northwest National Laboratory, lead author/postdoctoral researcher Gavin Cornwell and atmospheric scientist Susannah Burrows.
The two researchers tapped into ARM data to investigate the transport of soil dusts, an important and chemically diverse source of aerosols in agricultural regions. (Aerosols are ultrafine liquid and solid particles suspended in the air.) Dust aerosols also act as ice-nucleating particles, which influence the formation of rain droplets, lightning, and the dynamics and radiative property of clouds.
The backdrop for the Cornwell-Burrows research was ARM’s Southern Great Plains atmospheric observatory, which spans parts of rural Oklahoma and Kansas. They looked at how dust particles are lifted by vertical transport to cloud-relevant altitudes―a step that is challenging to represent in regional and global models.
Cornwell and Burrows used large-eddy simulations (LES) to arrive at values for the turbulent energy and to simulate vertical transport. They leveraged simulations from the LES ARM Symbiotic Simulation and Observation (LASSO) activity as input data for a modified version of a dispersion model called FLEXPART-WRF, which simulated the vertical transport of agricultural dust within the turbulent boundary layer. (WRF is the Weather Research and Forecasting mesoscale meteorological model.)
Their paper and the related poster show a potentially large potential for error in most models in simulating the amount of particulate matter exported from the surface into higher levels of the boundary layer, where clouds are formed. Cornwell and Burrows also explain how to run the new model and its special options and features.
Future studies, they say, will couple this approach with machine learning techniques as a way of improving model representations of large-scale turbulence.
–Corydon Ireland
How to Execute a Successful Large-Scale Campaign
DOE ARM Program Manager Sally McFarlane co-chaired a December 9 AGU town hall hosted by the U.S. Global Change Research Program Interagency Working Group. Emphasizing interagency coordinated observational activities tied to earth systems and global change, the town hall focused on the conception, execution, and results of two large multi-institutional field campaigns.
The Fire Influence on Regional to Global Environments and Air Quality (FIREX-AQ) campaign of 2019 studied smoke from U.S. wildfires and agricultural burns. The 2008 Variability of the American Monsoon Systems (VAMOS) Ocean-Cloud-Atmosphere-Land Study (VOCALS) in Chile sought to improve understanding of earth system processes in the southeastern Pacific.
Speakers included ARM veterans Chris Bretherton, Yangang Liu, and Chris Fairall. A common thread throughout the presentations was the value of collaboration and communication in overcoming challenges and carrying out the science of both campaigns.
For early career scientists, the message was to get involved. Watching resources coming together and working in the field “prepares you to be sitting in that chair to organize the whole thing one day,” said NASA’s Jim Crawford, a mission scientist for FIREX-AQ.
Monika Kopacz, a program manager within NOAA’s Climate Program Office, encouraged the almost 80 town hall attendees to reach out to program managers if they are interested in participating in a project. “We’re always there to talk to everybody, especially if it’s an early career scientist who wants to know what’s going on in the field.”
–Katie Dorsey
Catch up on ARM Town Halls
AGU2020 featured three ARM-related town halls in the first eight days of the meeting.
In case you missed the town halls, here are recaps of each:
- December 1: A Behind-the-Scenes Look at Working With ARM (collaborating with a DOE user facility)
- December 2: ARM Takes Aim at the Stormy U.S. Southeast (science and deployment plan for the third ARM Mobile Facility)
- December 8: SAIL Town Hall Emphasizes Collaborative, Interdisciplinary Science (Surface Atmosphere Integrated Field Laboratory campaign in Colorado).
–Katie Dorsey
December 8, 2020
Ice-Nucleating Particles in Remote Marine Environments
Aquatic environments cover 70% of the Earth’s surface and are the most abundant sources of atmospheric aerosols. (These tiny particles contribute to the growth of clouds.)
Sea spray aerosol, created when waves break and the resultant bubbles burst, has a big influence on the chemical composition and biodiversity of the atmosphere. Such particles also act as cloud condensation nuclei and ice-nucleating particles (INPs), which in turn influence the radiative properties of clouds.
An AGU2020 session on aquatic aerosols drew nine brief talks on December 8. Among the presenters was Pacific Northwest National Laboratory (PNNL) atmospheric scientist Susannah Burrows, who offered a glimpse of her work on new perspectives on modeling INPs in the remote marine atmosphere.
The research, supported by the DOE Early Career Research Program, drew on data from two ARM field campaigns that took place in the Southern Ocean: the Macquarie Island Cloud and Radiation Experiment (MICRE) from 2016 to 2018 and Measurements of Aerosols, Radiation, and Clouds over the Southern Ocean (MARCUS) from 2017 to 2018. Respectively, they were land-bound and shipborne field campaigns. Both dealt in part with aerosols in the remote marine boundary layer.
The modeling efforts of Burrows and her team are focused on improving the way marine INPs are represented in global climate models. (A related AGU2020 poster is in place, by Burrows team member Aishwarya Raman, a PNNL postdoctoral research assistant. Burrows also called out the efforts of another postdoctoral team member at PNNL, Isabelle Steinke, who did yeoman’s work on the subject of the talk.)
In the few minutes she had during her invited talk, Burrows focused on one aspect of her team’s work: the idea that episodic increases in INP number may be linked to “jet-drop” sea spray, which seems to transfer INPs more efficiently than a counterpart mechanism known as “film-drop” sea spray.
Film drops are formed when the caps of bubbles burst on the sea surface and take up organic species in the water’s top microlayer. Jet drops are formed from the base of the breaking bubbles and generate larger, “super-micrometer” particles.
They display “a composition more representative of the water underneath,” said Burrows, whose team (among other model-improving factors) is looking for “a better understanding of what role jet-drop INPs might play.”
–Corydon Ireland
An Arctic Report Card
Warmer. Less frozen. Biologically altered.
That sums up the state of the Arctic as laid out in the latest edition of the Arctic Report Card. A book of science essays by that name has been published annually since 2006 by NOAA. Midway through AGU2020, a December 8 press conference featured glimpses of the latest edition from a panel of experts on the Northern Hemisphere’s fast-changing polar region.
Quick talks covered high-latitude wildland fires (getting bigger and more frequent); bowhead whales (doing well, in the short term, as the Arctic warms); algal productivity (blooming in the water column, declining on ice); and a retrospective on 15 years of the online report cards (213 essays, so far, on 59 topics). Another essay reported an upgrade to NOAA’s venerable Barrow Atmospheric Baseline Observatory. It included a nod to ARM’s North Slope of Alaska atmospheric observatory.
Among the report-card authors delivering talks was Matthew Shupe, an ARM campaign veteran who is part of the Cooperative Institute for Research in Environmental Sciences (CIRES). CIRES is a partnership of NOAA and the University of Colorado, Boulder.
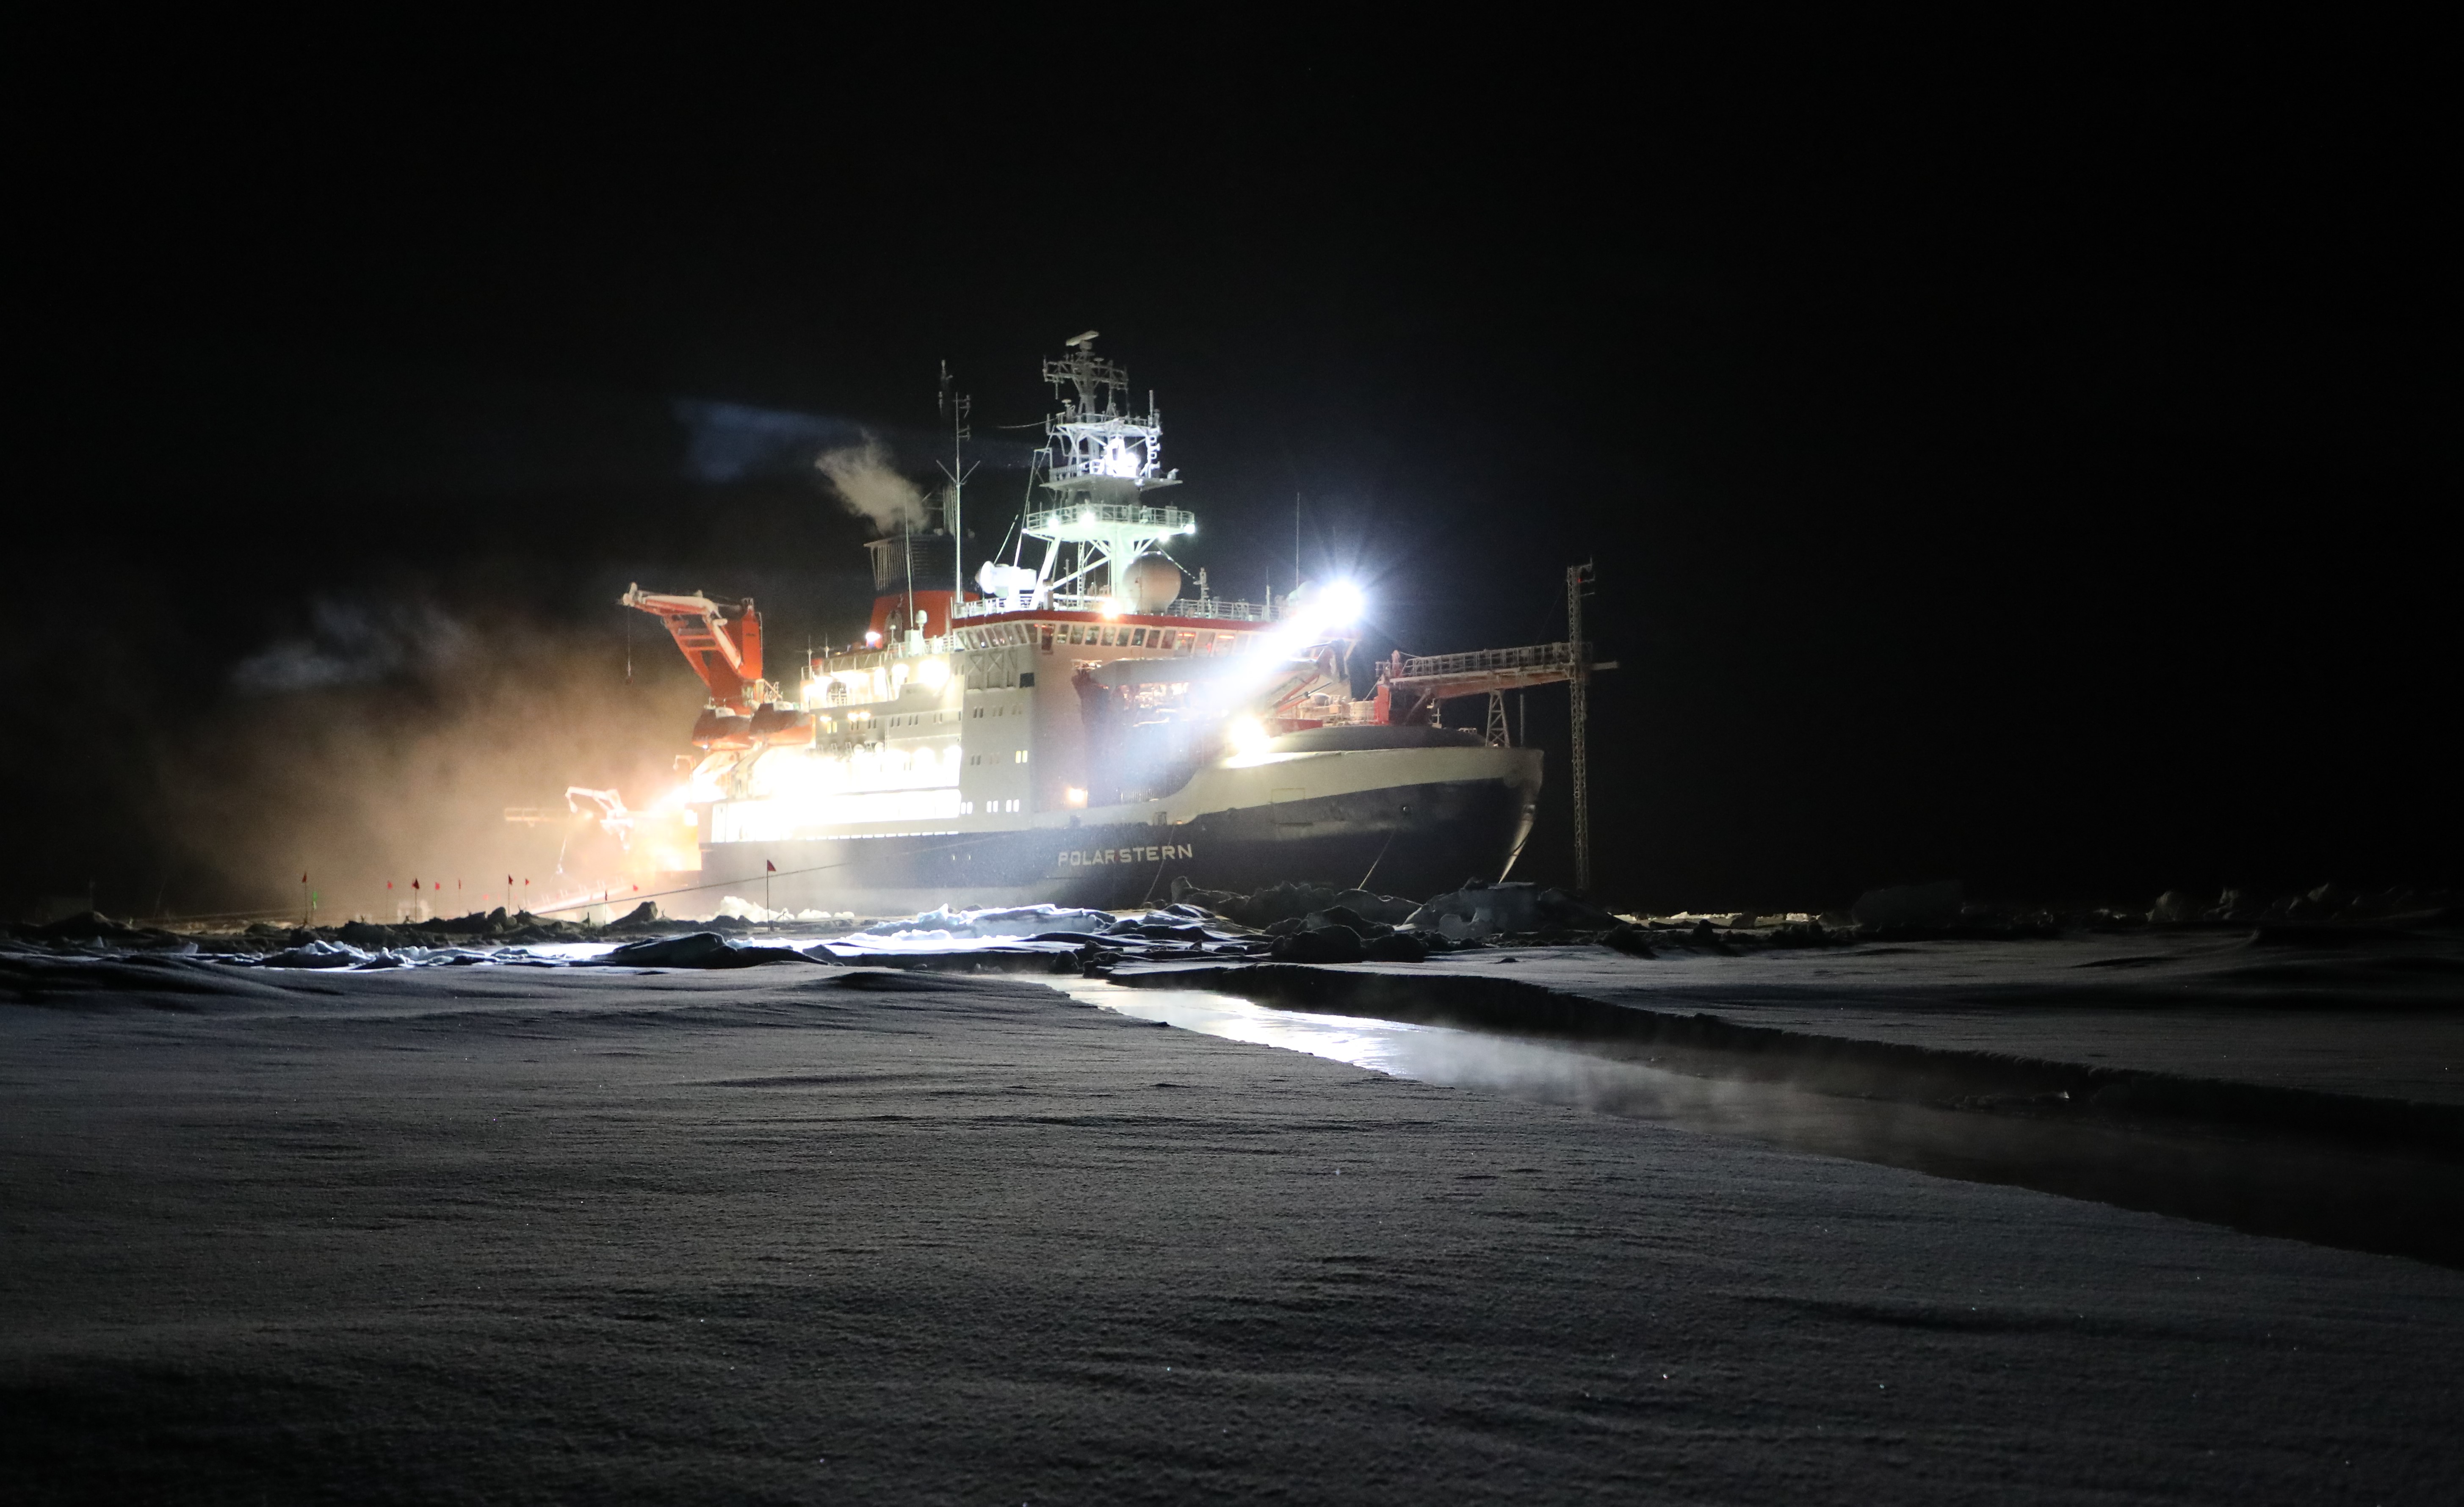
Shupe is the lead author of a report-card essay entitled “The MOSAiC Expedition: A Year Drifting with the Arctic Sea Ice,” the best-equipped investigation of the central Arctic to date. What is formally called the Multidisciplinary Drifting Observatory for the Study of Arctic Climate closed out its yearlong shipborne observations in October 2020.
Shupe was a co-coordinator of MOSAiC and the lead scientist for ARM’s portion of the expedition, which focused on atmospheric processes. ARM deployed radars, lidars, aerosol counters, and other atmospheric instrumentation on the bow of the R/V Polarstern, MOSAiC’s mother ship for the expedition overseer, Germany’s Alfred Wegener Institute.
Sea ice was a popular topic of discussion during the conference. One essay in the report spelled out declines in arctic sea ice cover related to extent, thickness, and volume. (The second-lowest summer extent on record occurred in 2020.) Sea ice is important to the climate system because its albedo (reflectivity) bounces solar radiation back out into the atmosphere during the summer; without ice cover, the Arctic gets warmer.
The decline and evolution of sea ice cover, and its consequences, said Shupe, was the major motivating scientific question behind MOSAiC and its myriad instruments recording the physics, chemistry, and biology of the Arctic as the ship drifted, frozen in place, for the better part of a year.
The earliest realization was that the ice was historically very thin―so dynamic, said Shupe, that it would “crack and shift,” making frequent re-installations of instruments on the ice necessary.
In the end, however, the rewards were great.
“MOSAiC represents the most comprehensive set of observations ever made in the central Arctic,” Shupe told his audience of reporters. “There’s a tremendous data legacy that will feed the arctic research community for years.”
An AGU2020 press conference focusing on MOSAiC alone is slated for 8 a.m. Pacific time on Tuesday, December 15.
–Corydon Ireland
A Look Ahead at TRACER
Early in a series of 14 flash talks on cloud-aerosol-precipitation interactions at AGU on December 8, clouds rumbled and lightning struck (at least in concept) during a three-minute preview of ARM’s 2021–2022 TRacking Aerosol Convection interactions ExpeRiment (TRACER).
Lead scientist Michael Jensen of Brookhaven National Laboratory introduced storm-wracked Houston, Texas, as an outdoor laboratory, where interagency and university scientists will converge to investigate a hotly debated issue: the influence of aerosol on deep convective cloud properties.
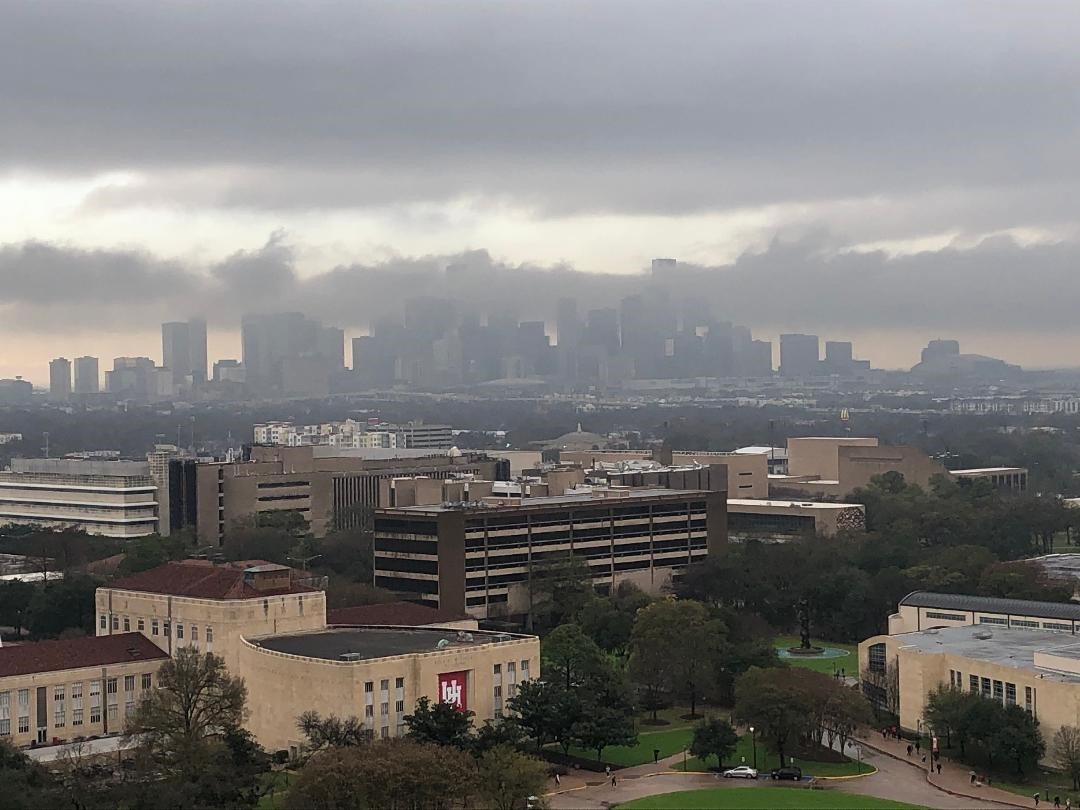
The Houston region, beset by reliably severe seasonal storms, lies within a humid subtropical climate regime that pilot studies showed is uniquely influenced by both sea breezes and aerosol conditions from urban and industrial sources. The TRACER deployment, scheduled to start June 1, is designed to capture a baseline of high-resolution, rapid-sampling observations needed for models.
Taking a central role is the first ARM Mobile Facility, which will be sited in a highly polluted area in La Porte, Texas, near the Houston Ship Channel.
ARM also plans to deploy a second-generation C-Band Scanning ARM Precipitation Radar south of downtown Houston to focus on the movement of convective storm cells and updraft precipitation microphysics.
An ancillary site southwest of Houston will capture background atmospheric-state data in a relatively unpolluted area of the region. Tethered balloon launches are also planned.
Meanwhile, more than 200 legacy Houston-area measurement systems will come into play for surface meteorology, trace gases, and other factors.
Layered over that depth of resources, said Jensen, is an array of partnerships. Those include:
- 10 university-based aerosol and cloud lifecycle projects sponsored by DOE’s Atmospheric System Research
- the National Science Foundation’s Experiment of Sea Breeze Convection, Aerosol, Precipitation, and Environment (ESCAPE) campaign
- NASA’s TRACER-Air Quality project and Precipitation Measurement Mission
- measurement platforms such as aircraft, radar, radiosonde, and research trucks
- a NOAA campaign called Atmospheric Emissions and Reactions Observed from Megacities to Marine Areas (AEROMMA).
Jensen ended on a practical note, pointing out that several DOE scientists are still looking for summer interns (and beyond) for TRACER-related modeling and other work. The Science Undergraduate Laboratory Internships program, for instance, has a deadline of January 12, 2021.
–Corydon Ireland
SAIL Town Hall
A town hall on the Surface Atmosphere Integrated Field Laboratory (SAIL) field campaign will be held from 4–5 p.m. Pacific time today.
Scheduled from September 2021 to June 2023 in the Colorado Rockies, SAIL will link up with the DOE Subsurface Biogeochemistry Research program’s Watershed Function Scientific Focus Area to enable atmosphere-through-bedrock observations of the East River Watershed. This watershed in central Colorado is part of the Upper Colorado River Basin.
A multi-institutional group of presenters will talk today about SAIL science, community needs from the campaign, and opportunities for collaboration.
“The team wants to engage with a broad audience of interested researchers and learn more about how you would like to participate in the campaign,” said SAIL Principal Investigator Daniel Feldman in a November ARM blog post.
On Wednesday, December 16, a SAIL-related poster from Feldman will be part of AGU session A230 – The Far-Infrared: Exploring the Final Frontier in Measuring Earth’s Climate and Energy Balance II. (View the abstract and poster.)
–Katie Dorsey
Meet With ARM Representatives
Join our featured ARM users and facility managers in the virtual ARM booth at the following times to learn more about ARM and how to become a user. You can find ARM’s booth in the Exhibit Hall next to AGU.
Date/Pacific Time
Tuesday, December 8
8–9 a.m.: Michael Jensen and ARM Engineering and Process Manager Jennifer Comstock
10–10:30 a.m.: ARM Technical Director Jim Mather
3–4 p.m.: Yang Tian
Wednesday, December 9
8–9 a.m.: Chongai Kuang, site science team lead for the upcoming Southeastern U.S. deployment of the third ARM Mobile Facility, and ARM Engineering and Process Manager Jennifer Comstock
10–10:30 a.m.: DOE ARM Program Manager Sally McFarlane and ARM Technical Director Jim Mather
3–4 p.m.: Shaocheng Xie, ARM value-added products and translators lead
Thursday, December 10
8–9 a.m.: Steve Nesbitt and ARM Engineering and Process Manager Jennifer Comstock
Friday, December 11
8–9 a.m.: Virendra Ghate
Also, ARM Data Center staff will be in the booth all week from 8–9 a.m., 10–10:30 a.m., and 3–4 p.m. Pacific time to talk with you about ARM data.
Visit the booth chat wall to get the ZoomGov link.
December 7, 2020
Catching Cold-Air Outbreaks
With rapid sea ice loss and rising air temperatures, polar regions are warming faster than any other region on Earth. But how do changes in both the northern and southern high latitudes connect to changes in the midlatitudes and to global earth system changes at large?
One answer involves a poorly understood cloud regime known as cold-air outbreaks (CAOs), which occur when cold air, such as from the edge of the Arctic Ocean, streams over the relatively warm water of open oceans. CAOs happen all over the world where cold places intersect with warmer ones.
CAOs, hard to forecast, create strong surface fluxes of heat and moisture, which in turn support shallow but highly convective cloud systems. Taken broadly, CAOs affect global energy and water cycles in a big way, and they influence ocean circulation.
CAOs are hard to model, however, in part because of the range of scale involved and the difficulty of getting in situ observations in such vast and severe environments.
To overcome this deficiency, two recent ARM field campaigns took on the measurement challenge and were featured in a December 7 AGU talk presented by Bart Geerts, a University of Wyoming atmospheric scientist.
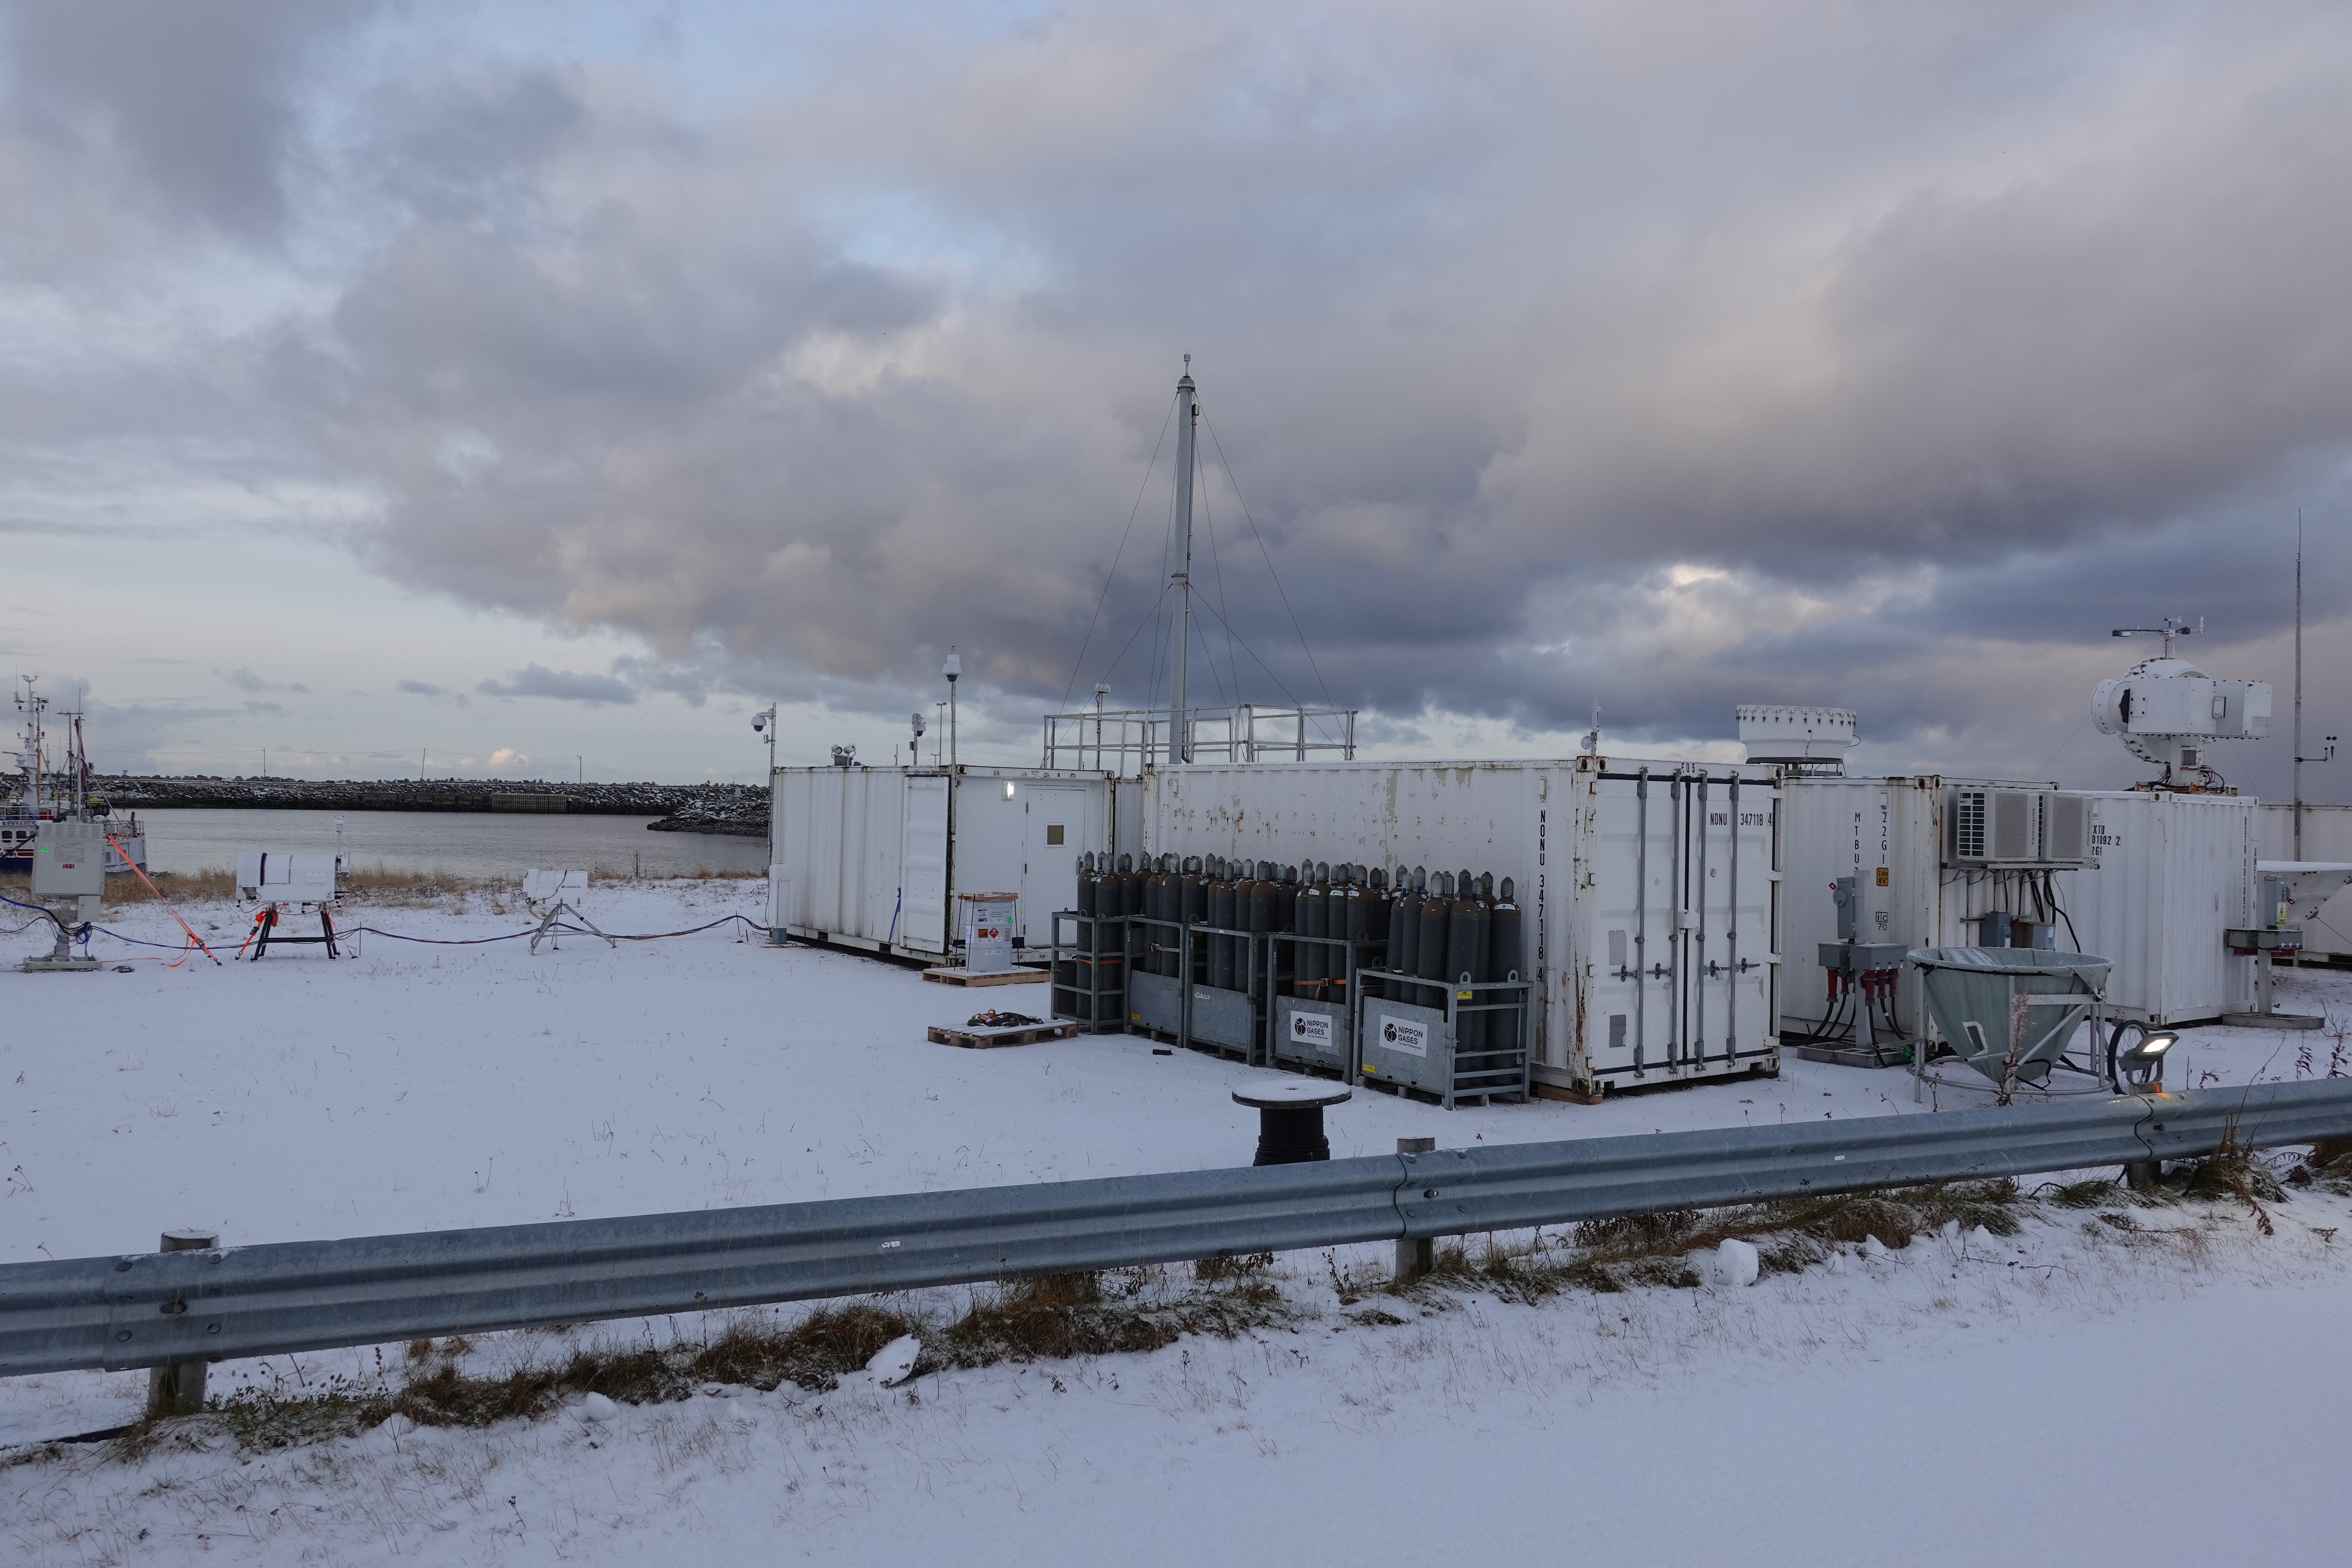
Geerts was the lead scientist for ARM’s 2019–2020 Cold-Air Outbreaks in the Marine Boundary Layer Experiment (COMBLE), a field campaign that pivoted on in situ observations from two sites. The main site, anchored by an ARM Mobile Facility, was on Andøya, an island in far-northern Norway on the Norwegian Sea, about 1,000 kilometers (621 miles) from the icy edge of the Arctic Ocean. A secondary site, only 500 kilometers (310 miles) from the edge of the Arctic, was on Norway’s Bear Island.
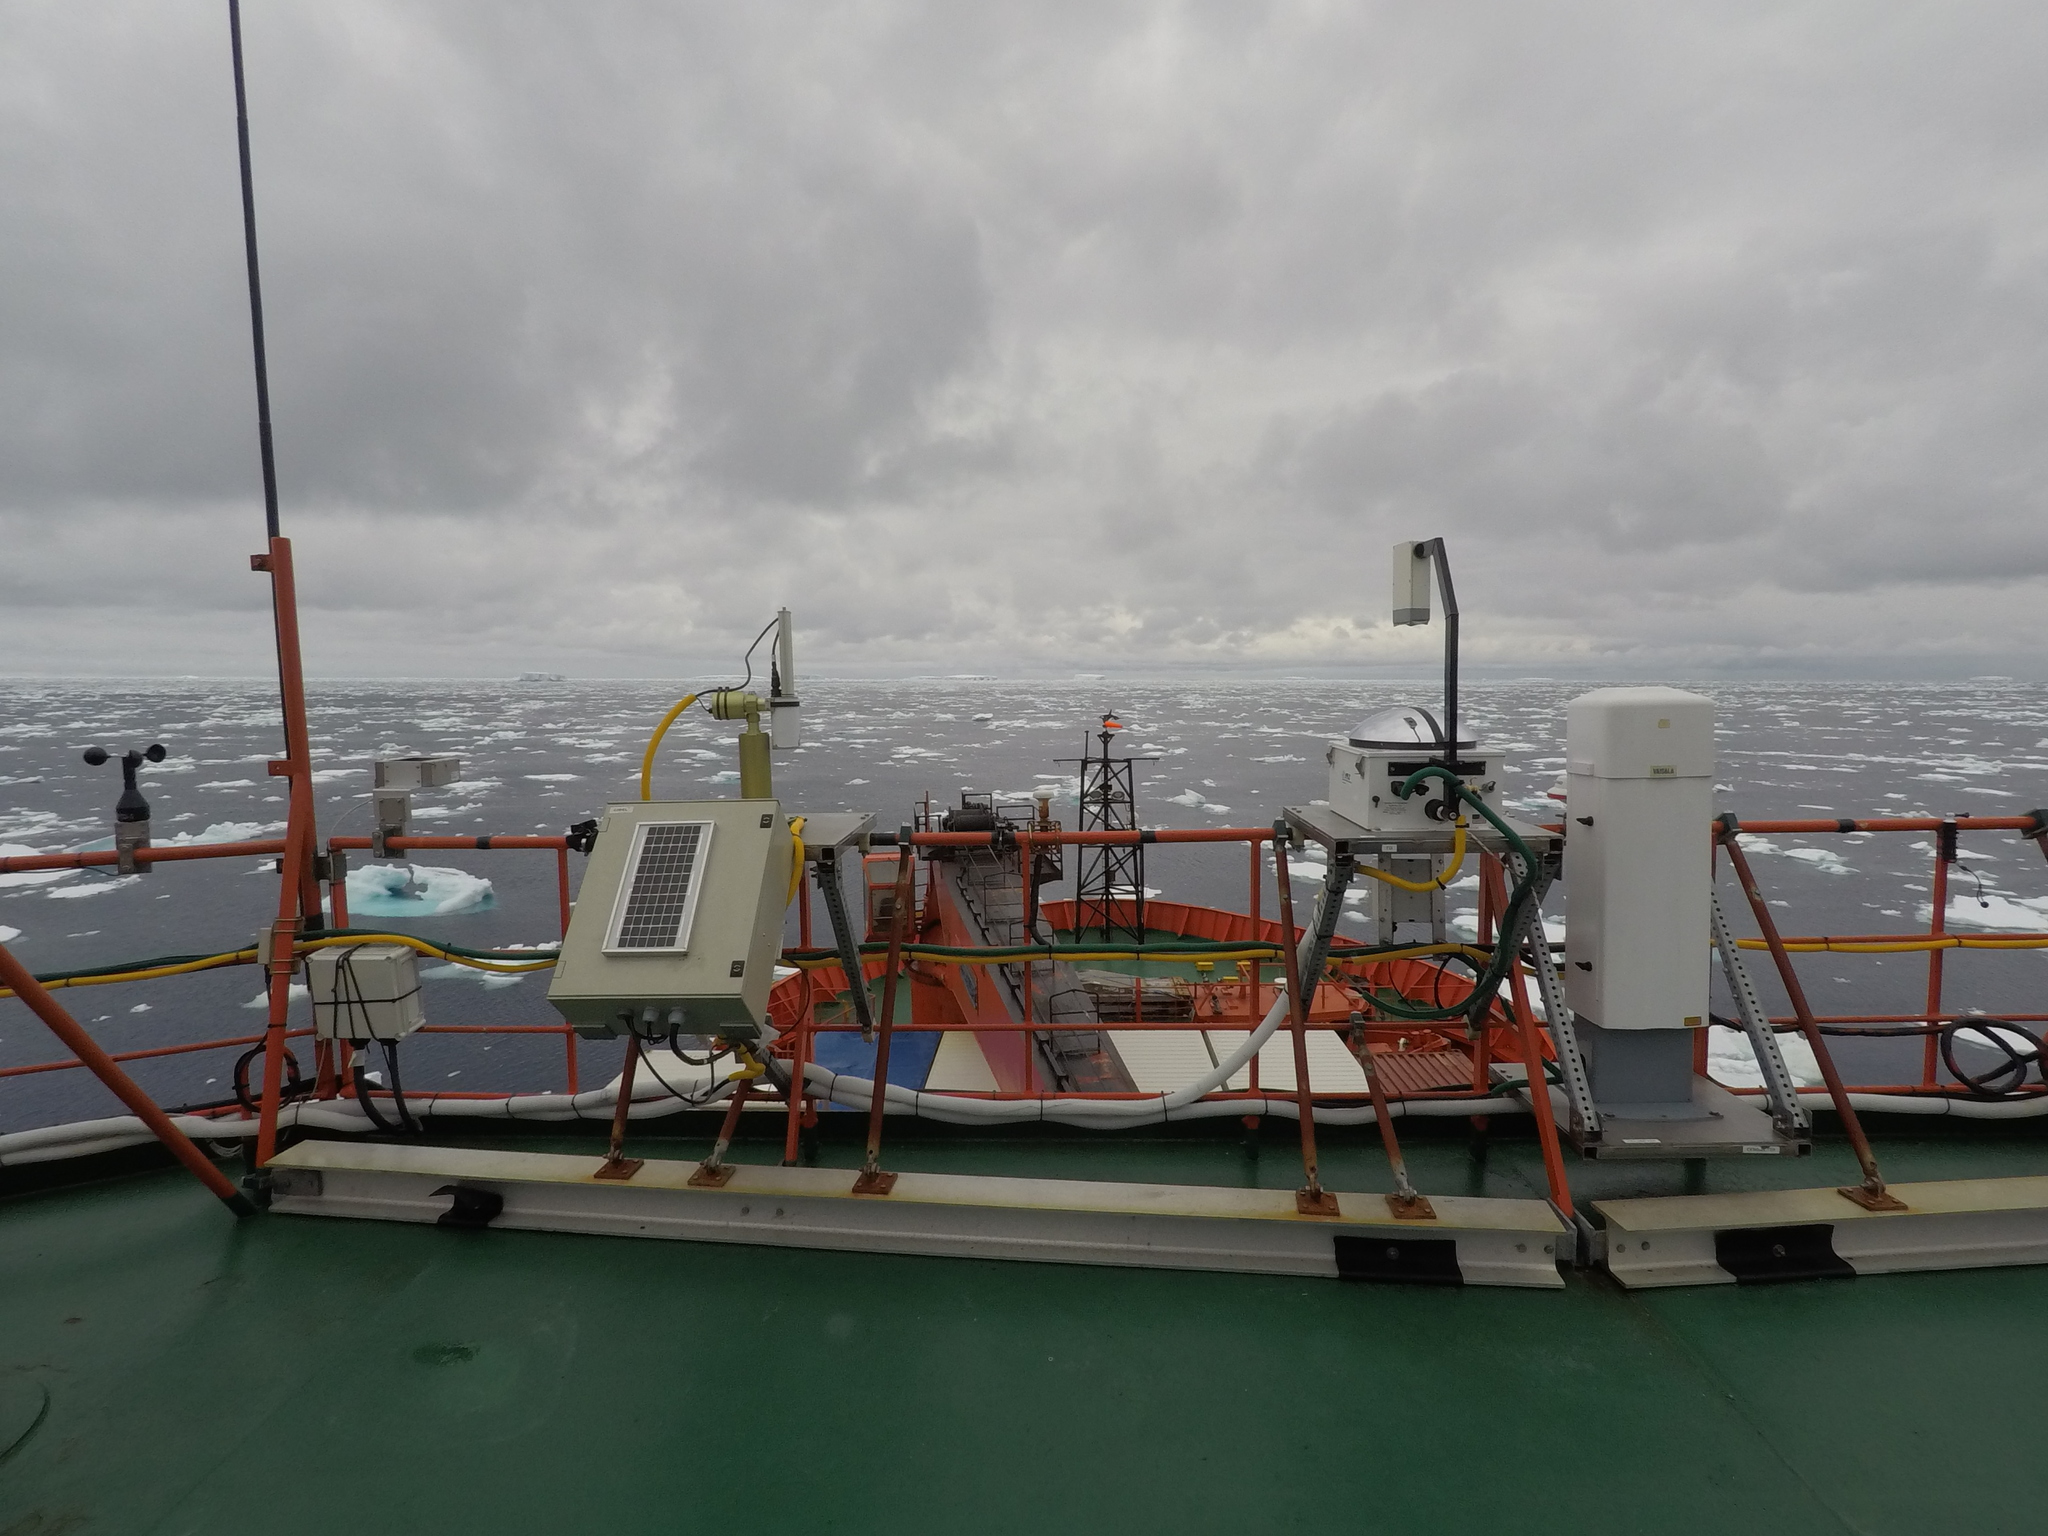
The second germane field campaign Geerts discussed was a shipborne effort in the opposite hemisphere, ARM’s 2017–2018 Measurements of Aerosols, Radiation, and Clouds over the Southern Ocean (MARCUS) field campaign. MARCUS was led by Greg McFarquhar, a University of Oklahoma researcher who was just named an AGU Fellow.
In both cases, scientists expanded what is known about CAOs in the marine boundary layer, including getting better data on cloud properties, rain and snow amounts, surface fluxes, cloud evolution, and boundary-layer structure. For one, COMBLE provided clues to how clouds in CAOs transition from linear “cloud streets” to grouped cells of clouds, “a growth process that is poorly understood,” said Geerts.
In July 2020, he was one of 31 scientists to receive one of the latest funding awards from DOE’s Atmospheric System Research (ASR). Geerts will use the ASR award to develop numerical simulations of CAOs using a multiscale modeling framework.
He and two other scientists are planning a 2022 project that will use aircraft to explore CAOs in the northern North Atlantic, a sub-Arctic zone marked by these consequential transitions of cloud type. Likely based in Kiruna, Sweden, Cold Air outbreaks Experiment in the Sub-Arctic Region (CAESAR) will be funded by the National Science Foundation.
Joining Geerts in leading CAESAR are McFarquhar and Paquita Zuidema of the University of Miami, both veteran ARM researchers.
–Corydon Ireland
Flying Low and Cold
University of Colorado, Boulder, graduate research assistant Jonathan Hamilton was on Leg 4 of the Multidisciplinary Drifting Observatory for the Study of Arctic Climate (MOSAiC) expedition, which put him out on the ice for research from May through August 2020.
Hamilton’s specialty is piloting and maintaining unmanned aerial systems (UAS), though he prefers the term “remotely piloted aircraft systems,” or RPAS. But whatever the nomenclature, the small devices―designed to fly in prescribed low and slow patterns―came with a daunting set of technical challenges in the frigid high latitudes of the Arctic.
Hamilton outlined those in a December 7 AGU poster, touching on deep, cold, high winds; occasional low-visibility days; the long commute each day to and from the mothership, the R/V Polarstern; and―oh, yeah―polar bears.
There was also the issue of coordinating flight times and data-collection synergy with the expedition’s other aerial platform, including radiosondes sent aloft by ARM.
–Corydon Ireland
High-Flying MOSAiC
Some of the most spectacular images to come out of the Multidisciplinary Drifting Observatory for the Study of Arctic Climate (MOSAiC) expedition were snapped from unmanned aerial systems (UAS). But a lot of science got done that way too.
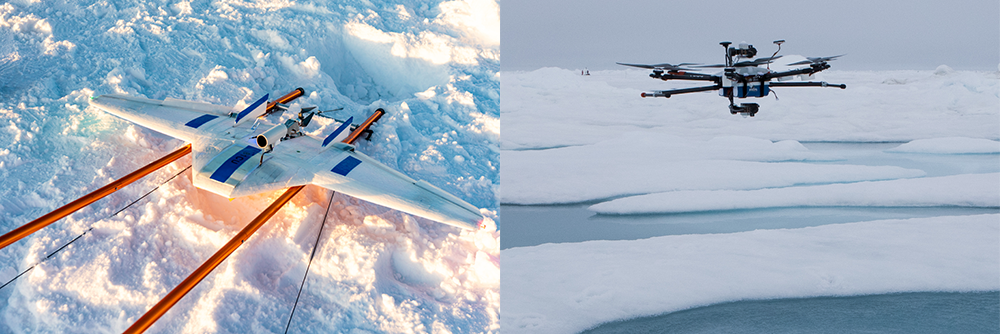
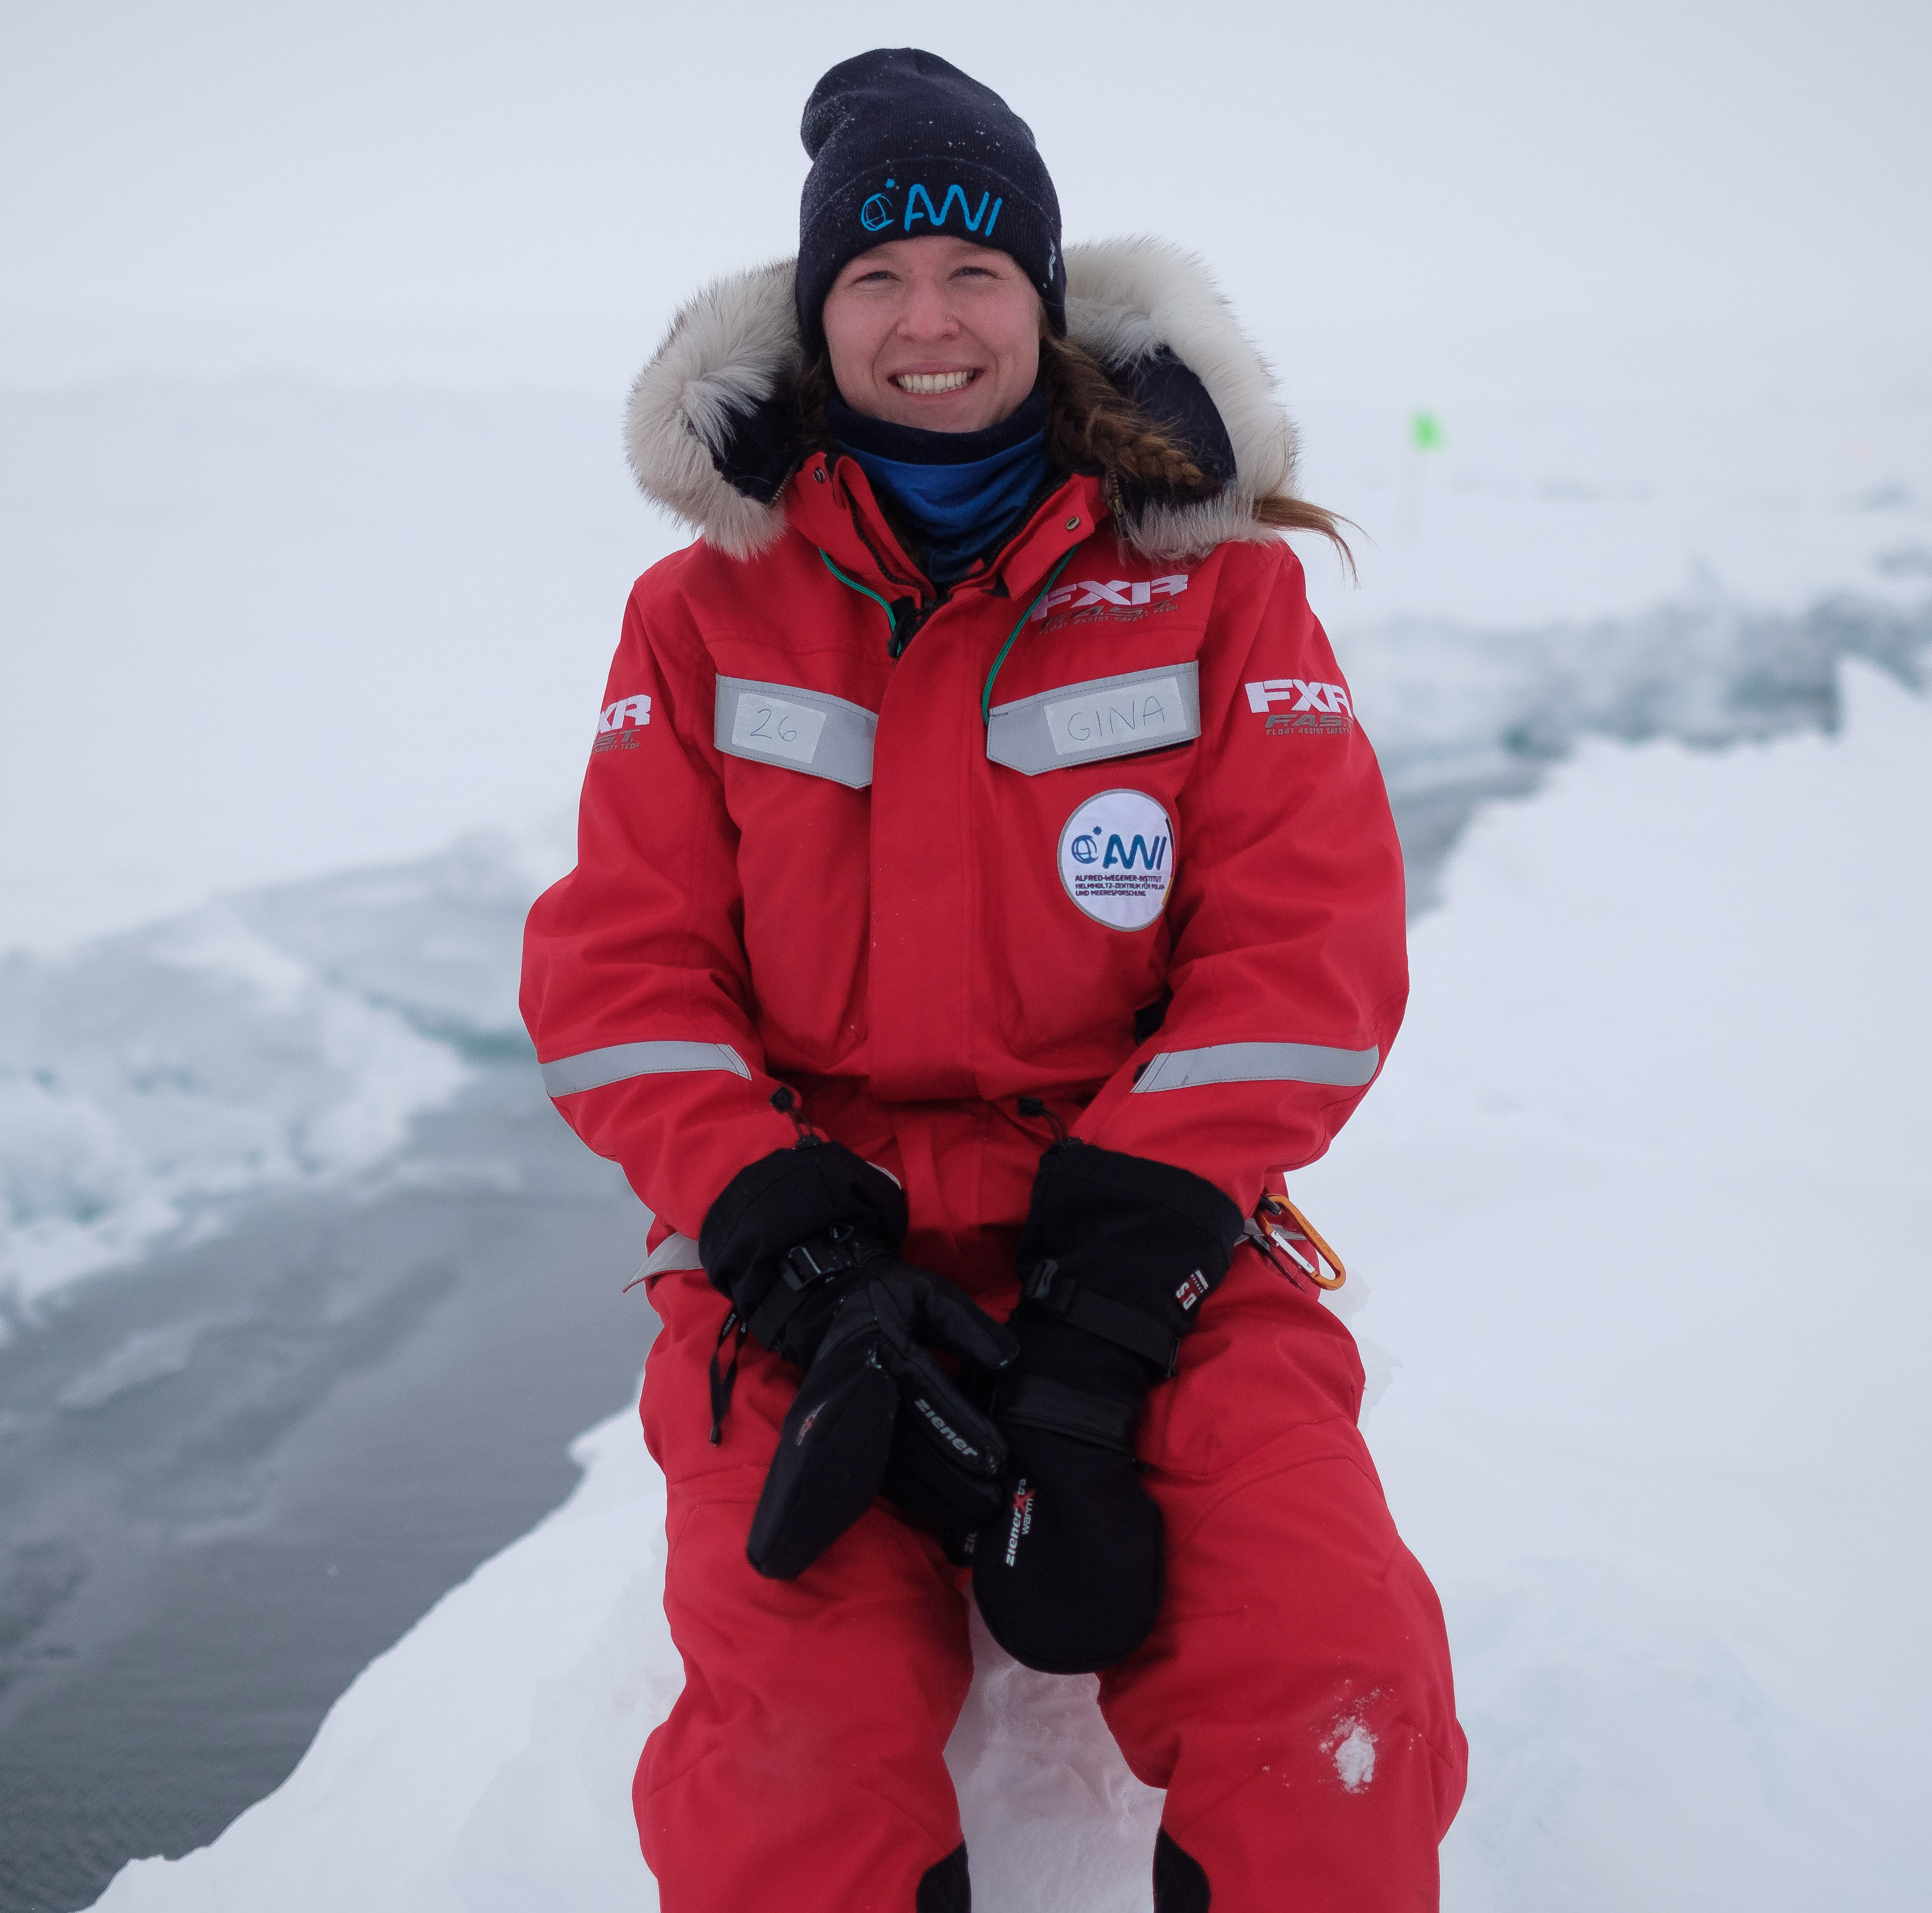
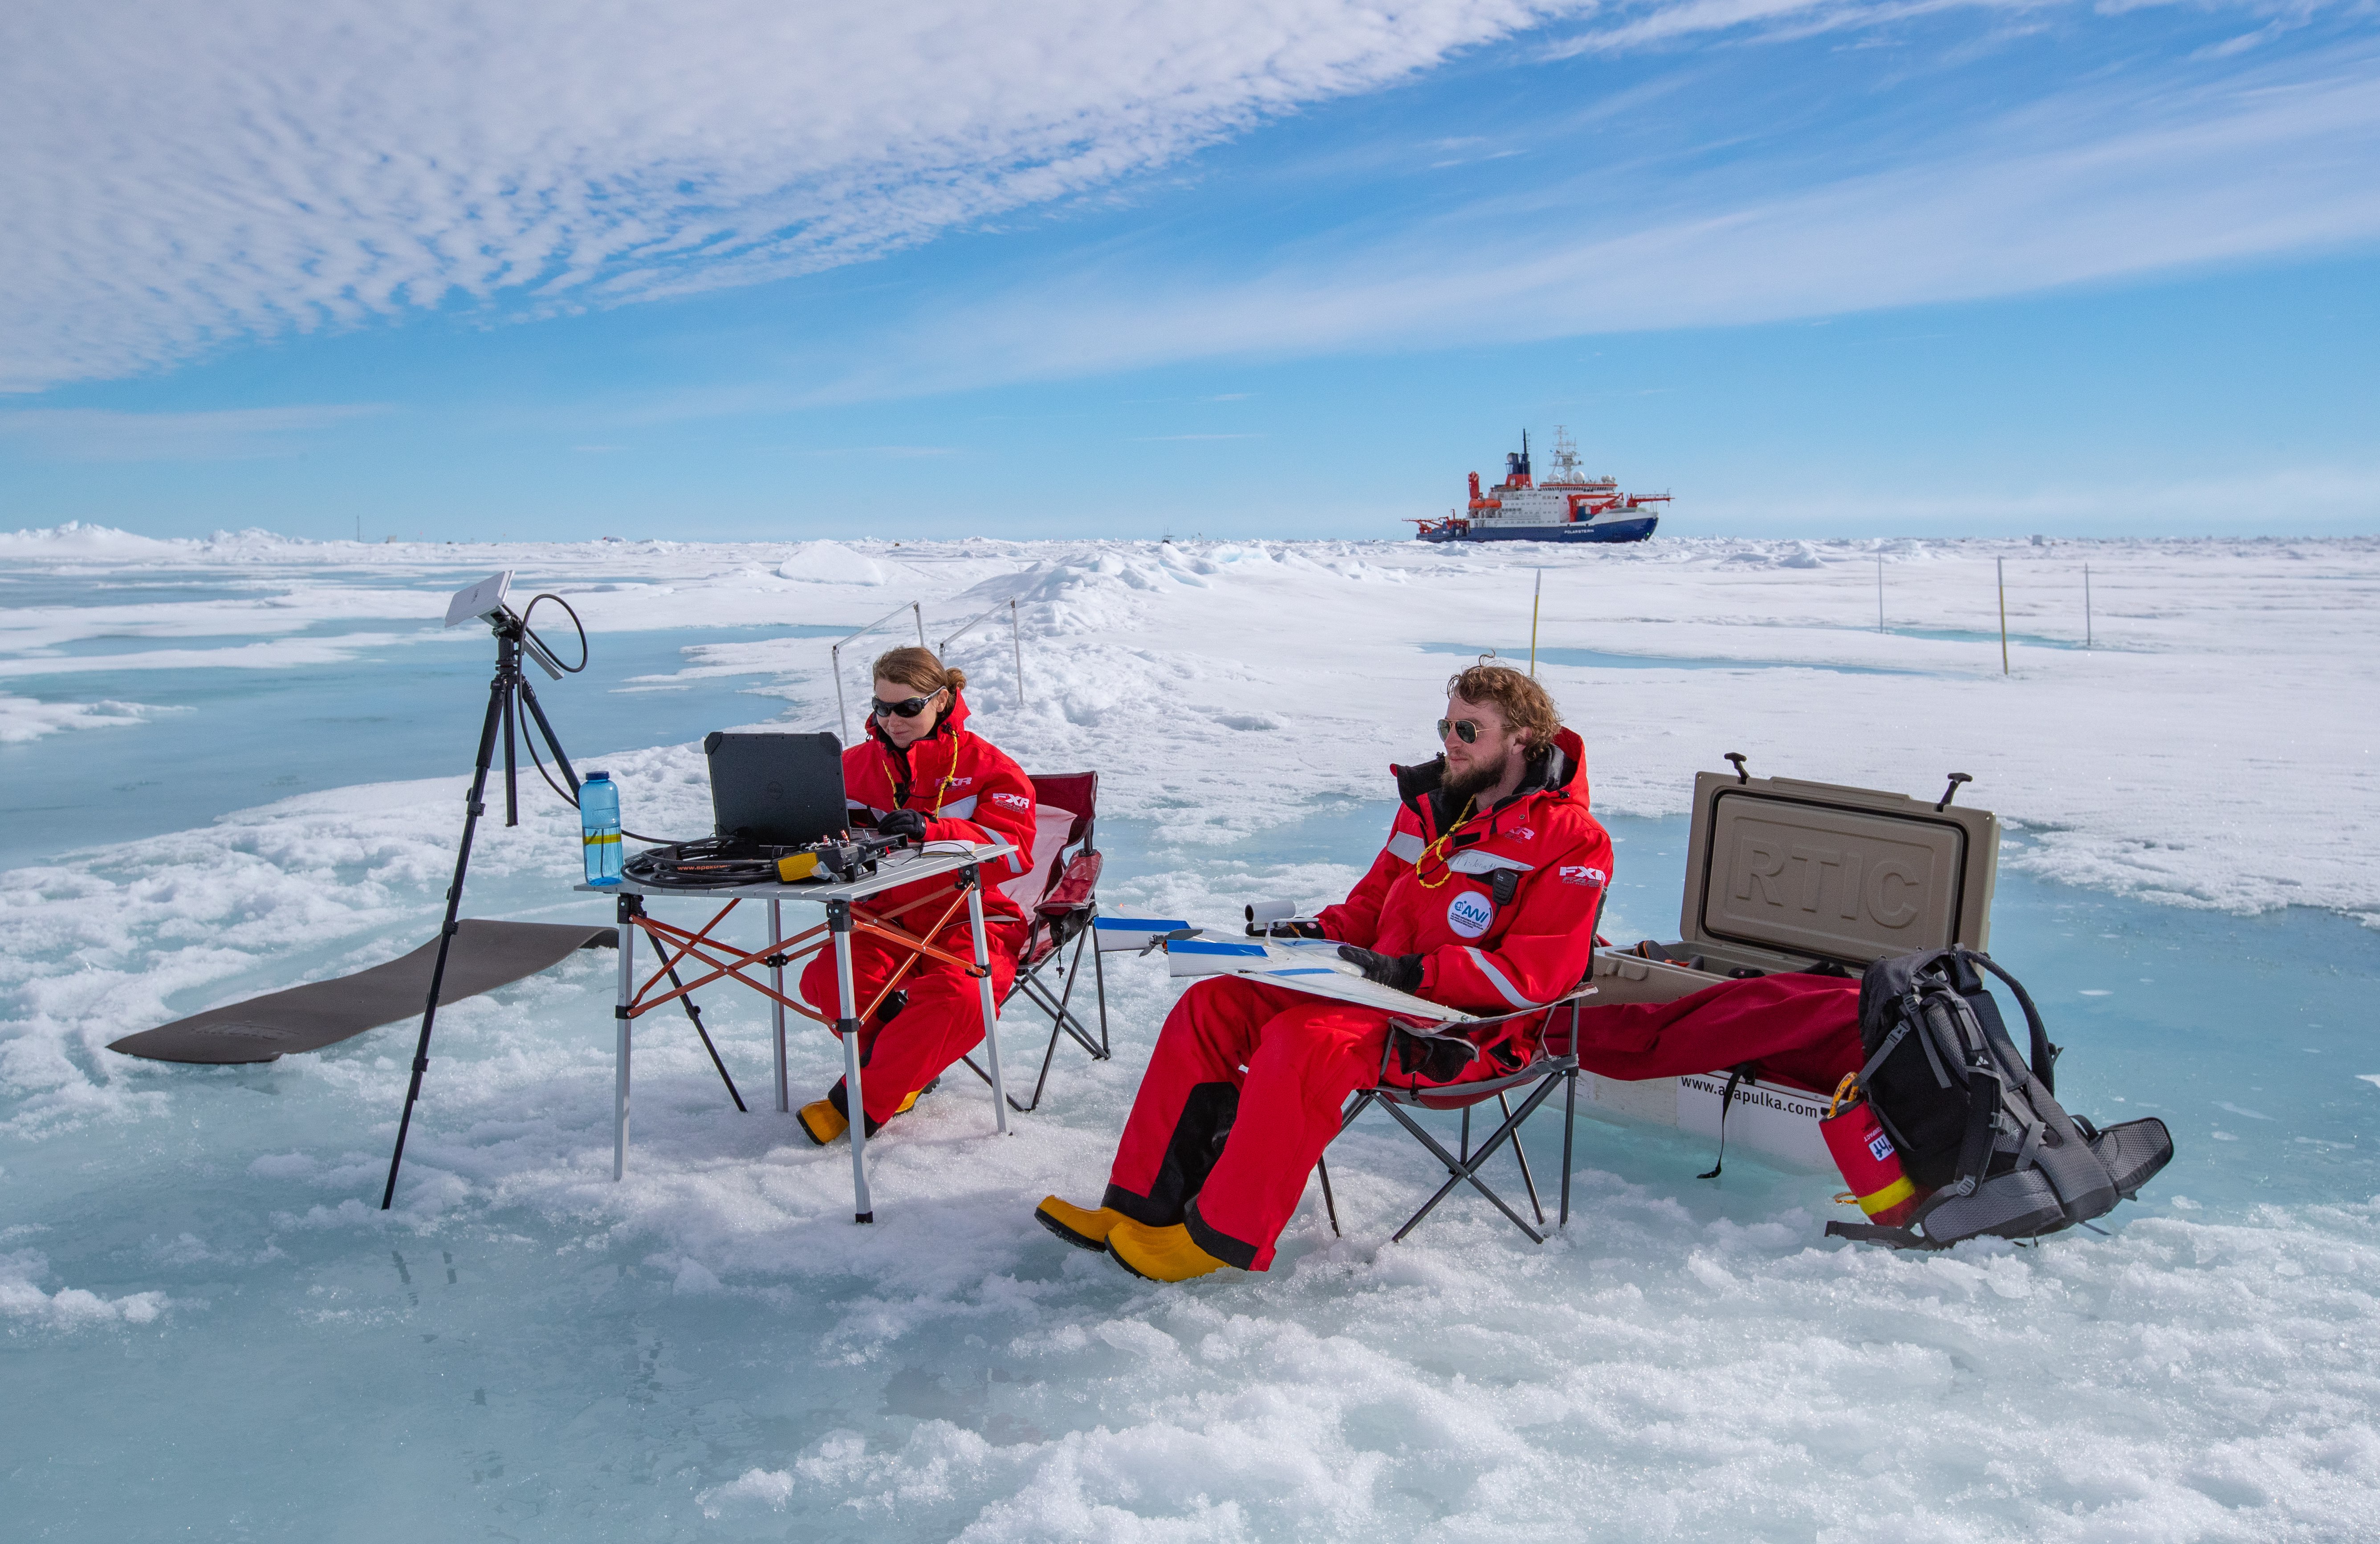
Gina Jozef, a second-year PhD student at the University of Colorado, Boulder, and a Leg 3 MOSAiC veteran and blogger, used a December 7 poster to deliver a look at how these small aerial vehicles contributed data to our understanding of the arctic atmospheric boundary layer. In high latitudes, how energy is transferred from the Earth’s surface to the atmosphere above is still a source of great uncertainty.
Jozef was part of a university team that flew two UAS during Legs 3 and 4 of MOSAiC, which spanned March through August 2020. One was the fixed-wing DataHawk2, which usually flew corkscrew patterns in ascending and descending circles of 75 to 100 meters (246 to 328 feet) in diameter and reaching altitudes of 1,000 meters (3,280 feet). The aim was to measure temperature, relative humidity, wind speeds, and other meteorological variables.
The other workhorse UAS was a Tarot X6 Hexacopter. It performed closer-in data collection related to arctic leads (narrow, linear cracks in the ice), albedo, and sea ice evolution.
“As far north as we flew,” said Jozef of the UAS work, “this has not been done before.”
Over time, she added, the University of Colorado’s UAS data will be combined for analysis with measurements from ARM radiosondes and ceilometers at work during MOSAiC.
Listening in on the poster chat, University of Oklahoma atmospheric scientist and newly minted AGU Fellow Greg McFarquhar observed that UAS have great utility for collecting boundary-layer data at low altitudes. “We’re pretty limited in what we can do in the lowest kilometer of the atmosphere.”
Check out Jozef’s blog, including photos, from her time on the MOSAiC expedition.
–Corydon Ireland
TRACER at AGU
Michael Jensen, principal investigator for the 2021–2022 TRacking Aerosol Convection interactions ExpeRiment (TRACER), will present an overview of TRACER and associated campaigns this week during the AGU Fall Meeting.
The eLightning session A045 – Cloud-Aerosol-Precipitation Interactions and Their Parameterizations in the Context of Weather and Climate will take place from 5:30–6:30 a.m. Pacific time Tuesday, December 8. Jensen will give a brief overview of his material during that session (view the abstract and poster), and the final 20–30 minutes will consist of a live Q&A with all presenters. A one-hour text chat will follow for interested participants.
Also, Jensen will be available for questions and discussion about TRACER and ARM from 8–9 a.m. Pacific time on December 8 at the virtual ARM booth. Drop in if you’re online!
–Katie Dorsey
Have ARM Data Questions? Ask the Data Experts
ARM Data Center staff will be available in the virtual ARM booth this week for #datahelpdesk sessions to answer your questions about ARM data and give demonstrations of Data Discovery.
Join ARM Data Center staff from Oak Ridge National Laboratory all week on ZoomGov (the link will be available on the ARM booth chat wall).
Date/Pacific Time
Monday, December 7
8–9 a.m.: Giri Prakash
10–10:30 a.m.: Maggie Davis and Rob Records
3–4 p.m.: Ric Cederwall
Tuesday, December 8
8–9 a.m.: Giri Prakash
10–10:30 a.m.: Maggie Davis and Rob Records
3–4 p.m.: Ric Cederwall
Wednesday, December 9
8–9 a.m.: Ranjeet Devarakonda
10–10:30 a.m.: Kavya Guntupally and Rob Records
3–4 p.m.: Ric Cederwall
Thursday, December 10
8–9 a.m.: Ranjeet Devarakonda and Harold Shanafield III
10–10:30 a.m.: Maggie Davis
3–4 p.m.: Rob Records
Friday, December 11
8–9 a.m.: Kavya Guntupally and Rachael Isphording
10–10:30 a.m.: Kavya Guntupally and Rachael Isphording
3–4 p.m.: Ric Cederwall
Meet the DOE ARM Program Manager
DOE ARM Program Manager Sally McFarlane will be in the virtual ARM booth from 10-10:30 a.m. Pacific time today. You can find the ARM booth by clicking into the Exhibit Hall after logging in to the AGU meeting page.
–Katie Dorsey
Follow Us:


Keep up with the Atmospheric Observer
Updates on ARM news, events, and opportunities delivered to your inbox
ARM User Profile
ARM welcomes users from all institutions and nations. A free ARM user account is needed to access ARM data.


