

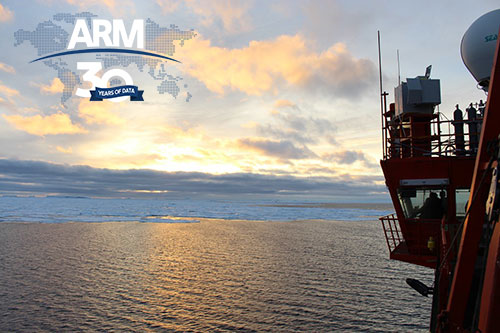
ARM Out on the Open Ocean
Published: 26 January 2023
Measurements taken aboard ships have added deep dimension to 30 years of atmospheric data
This is the sixth article in the yearlong “ARM30” series of stories on the evolution of ARM―its data, sites, science missions, field campaigns, and people.
Over three decades, one U.S. Department of Energy (DOE) facility has collected a little under 4 petabytes of freely available atmospheric data―on clouds, precipitation, and other phenomena that create weather and climate.
DOE’s Atmospheric Radiation Measurement (ARM) user facility operates three fixed and three mobile observatories in climatically important regions of the world.
Among the most important of those regions are oceans, which drive Earth’s climate. They comprise more than 70% of Earth’s surface area, generate about 80% of all precipitation, and are the backdrop of climate-critical exchanges of heat, gases, and energy.
Oceans supply most of the water vapor needed to make clouds. They also store and emit carbon dioxide and other greenhouse gases.
In addition, about 80% of the world’s low clouds exist over oceans. These clouds remain the greatest source of uncertainty in numerical models designed to predict global warming trends.
The world’s oceans span about 360 million square kilometers (140 million square miles)―about the size of 210 states of Alaska. Given such vastness, atmospheric data from the open ocean are understandably sparse.
‘Go to the Deep Ocean’
Unlike along ocean coastlines, atmospheric processes at play in the open ocean are hard to observe and measure.
For one, there are few surface instruments at sea, either aboard ships or other platforms such as buoys. That means routine data from within the marine boundary layer are scarce, including vital measurements of the vertical structure of clouds.
Satellite data, meanwhile, only partly observe what happens in the marine boundary layer, which is shielded by clouds and often less than a mile deep.
ARM has collected data from land and along ocean coastlines for decades, but the open ocean is a greater challenge.
If you want to understand marine cloud processes, says Joao Teixeira, co-director of the Center for Climate Sciences at the California Institute of Technology’s Jet Propulsion Laboratory, “you really need to go to the deep ocean.”
SHEBA, Early and Inspiring
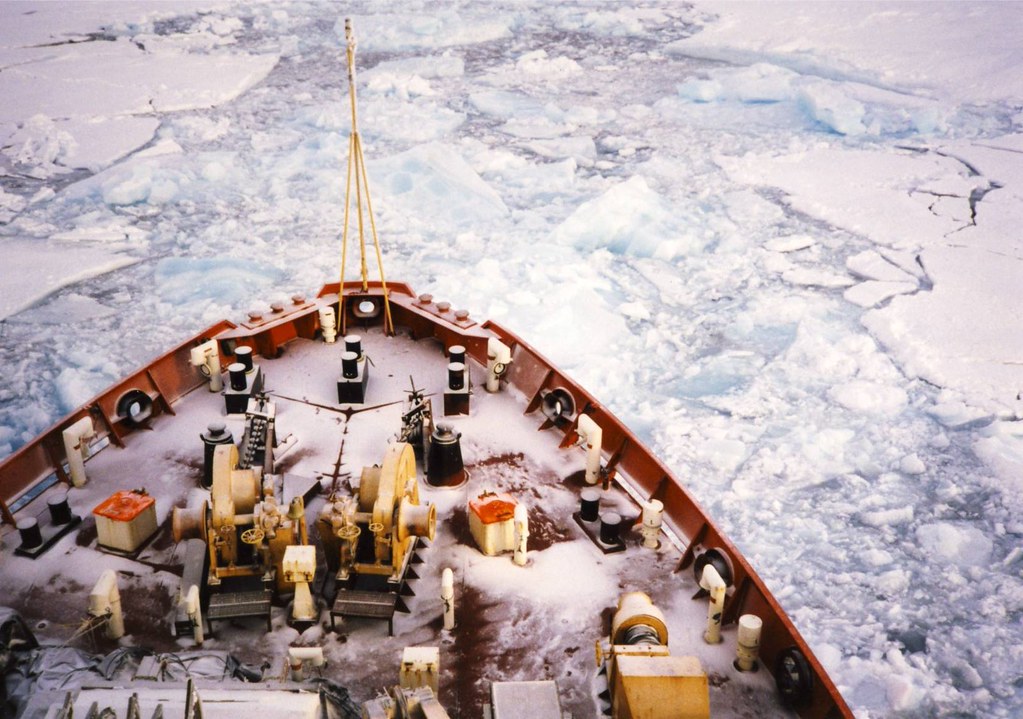
ARM first answered the deep-ocean imperative by taking part in a 1997–1998 National Science Foundation field campaign called Surface Heat Budget of the Arctic Ocean (SHEBA). It marked the first time ARM deployed instruments aboard a ship―in this case, the Canadian icebreaker Des Groseilliers, frozen into the ocean to drift for 13 data-rich months.
Along for the ride were ARM upwelling radiometers installed on the ice, shipboard downwelling radiometers, lidars, sky imagers, and a millimeter-wavelength cloud radar housed onboard the icebreaker.
Also along for the ride, over 18 weeks in three rotations, was ARM radar engineer Kevin Widener. During his 30-year career at Pacific Northwest Laboratory in Washington state, Widener prepared research-grade cloud radars for ARM.
Widener says the most important instrument that ARM fielded during SHEBA was an extended-range version of the atmospheric emitted radiance interferometer (ER-AERI).
ER-AERIs are deployed in dry climates like the Arctic to capture downwelling radiance even in the far-infrared spectrum. These instruments help researchers understand radiation transfer and the development of mixed liquid-and-ice clouds, even when the optical thickness of thin cirrus clouds is hard to measure.
During drifts of up to 16 kilometers (10 miles) a day, SHEBA collected data on the ship and at adjacent ice camps. Instruments measured cloud properties, surface reflectivity and heat fluxes, and the thermodynamic coupling of the atmosphere and an ice-covered ocean.
ARM data from SHEBA are still available, including 10 on vertical profiles of clouds and aerosols. More than 25 years later, scientists are still finding value in the data sets and publishing campaign-related papers.
SHEBA helped shape the logistics of future ARM open-ocean campaigns. It also left a profound legacy, says Widener, who retired in 2014: “growing the next generation of scientists.”
Those include ARM data user Matthew Shupe, a seven-month veteran of SHEBA. Since then, he has focused on arctic cloud and atmospheric processes at the University of Colorado and NOAA’s Physical Sciences Laboratory.
Making MAGIC
Widener also took part in the first ARM-only ocean campaign, the 2012–2013 Marine ARM GPCI Investigation of Clouds (MAGIC).
The principal investigator was Ernie Lewis, an atmospheric scientist and onetime oceanographer at Brookhaven National Laboratory in New York.
“Being (out) on the oceans is crucial,” says Lewis. “They are 70% of the world. And there’s so much we don’t understand and don’t have good measurements for.”
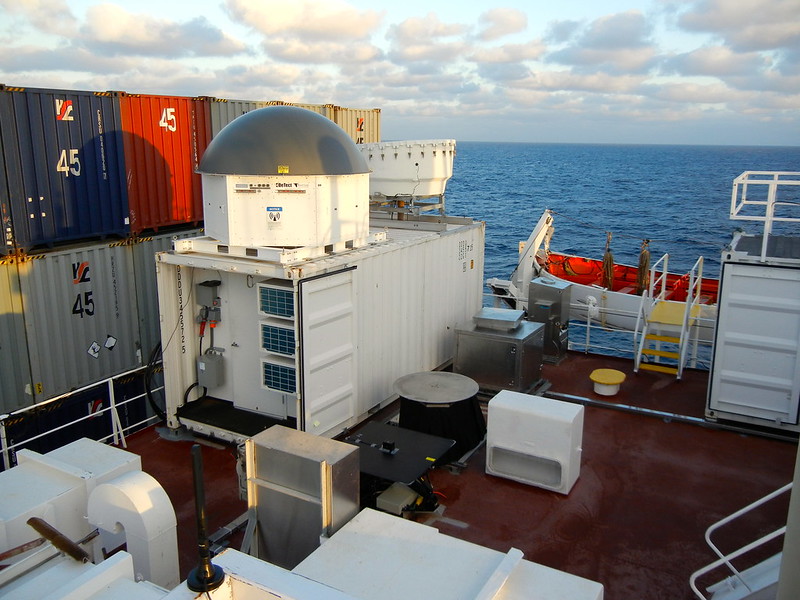
The campaign’s floating instrument platform was the 268-meter (880-foot) Horizon Lines container ship Spirit. During 200 days at sea and 20 transects between California and Hawaii, the MAGIC instruments stacked aboard swept up rare surface data.
Spirit’s forward decks hosted an ocean-hardened example of the ARM Mobile Facility that Widener helped develop more than two decades ago.
The mobile facility included three cargo containers packed with a suite of marine-capable instruments. Radars, lidars, radiometers, a total sky imager, a meteorological station, a radiosonde launcher, and other instruments measured key atmospheric and aerosol properties.
The main mission was to learn more about the climate-critical transition of one cloud regime to another.
Off the coast of California, low clouds called stratocumulus predominate. They are highly reflective and cover vast areas in horizontal decks. As such, they strongly influence how much radiation reaches the Earth’s surface. Overall, marine stratocumulus clouds have a net cooling effect.
Closer to Hawaii, following sharp cold-to-warm changes in surface temperature, shallow cumulus clouds take over. These puffy clouds composed of liquid water droplets tend to reflect less sunlight but create more rain than stratocumulus. In all, cumulus clouds significantly influence global surface evaporation.
Even a small change in clouds can make a big difference in climate change, says Teixeira, a MAGIC co-investigator.
In fact, he says, an increase of “just a couple of percent” in net-cooling stratocumulus coverage could make up for modern surface temperature increases linked to greenhouse gases.
Teixeira calls the transition of stratocumulus to cumulus “a critical open question in atmospheric science. Even today, the latest climate models do not represent this transition well.”
MAGIC helped establish a consensus on how the transition happens, he says, though the campaign’s data so far are “vastly unexplored.”
MAGIC produced a year of data on the vertical structure of mid-ocean clouds that are impossible to acquire from satellite instrument platforms. This is a data set, says Lewis, “that will be mined and used for quite, quite many decades.”
Five MAGIC-related publications in 2022 alone touch on marine cloud brightening, a high-resolution view of the boundary layer, MAGIC radiosondes, model aerosol predictions, and new insights into marine drizzle aided by machine learning.
Teixeira originated the idea of repurposing a container ship as an instrument platform, a concept ARM Director Jim Mather calls “ingenious.”
Using working container ships across the world in this way is “quite economical,” says Teixeira, who envisions a future full of penny-pinching, MAGIC-like data missions. “The more we could do something like that, the more (atmospheric) instruments there are on ships that move across the planet.”
Offshore With ACAPEX
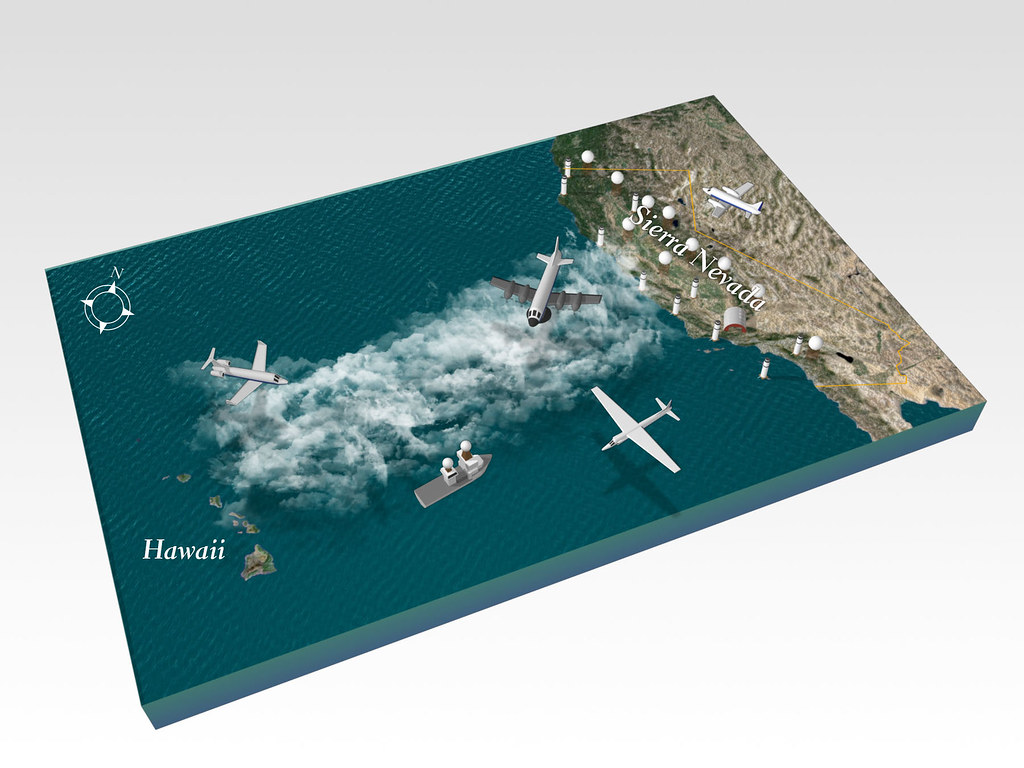
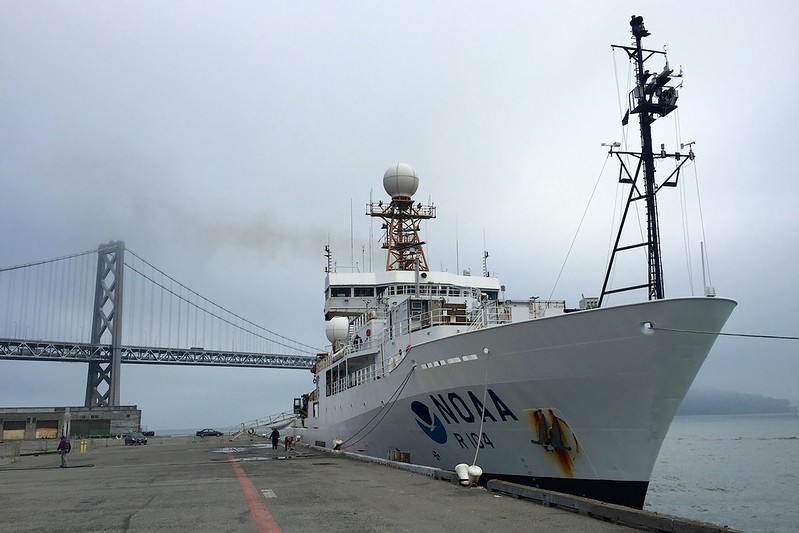
On January 14, 2015, less than two years after MAGIC, the NOAA research vessel Ronald H. Brown departed Honolulu, Hawaii, and set sail for San Diego, California. It was the start of the six-week ARM Cloud Aerosol Precipitation Experiment (ACAPEX), the first deployment by the user facility to employ coordinated sea-and-air measurement assets.
Aboard the ship were instruments packed into the same mobile facility used during MAGIC. Other instruments went aloft in four different research aircraft―one owned by DOE and the others by NOAA and NASA.
ACAPEX was executed jointly with CalWater 2, one in a series of multiagency experiments investigating precipitation and aerosol phenomena above the Pacific Ocean.
Both campaigns shared a mission in 2015: to gather data on atmospheric rivers, which are narrow bands of concentrated water vapor above the oceans. The resulting mobile highways of moisture, hundreds of miles long and sometimes packed with more water than multiple Mississippi Rivers, eventually fall to Earth as rain or snow.
Most rainfall in the western United States occurs in winter, linked to storms backed by atmospheric rivers moving in from the Pacific. Consequent snowpack provides up to 90% of regional water supplies for a year.
At the same time, atmospheric rivers can spur catastrophic flooding and land-pounding rains. By mid-January 2023, for example, the Associated Press reported that nine atmospheric rivers had pummeled California over three weeks. From space, the series of storms looked like whirling gray blades lashing a brown coastline.
More data on atmospheric rivers, including their related aerosol sources and cloud and precipitation processes, would reduce uncertainties in the models designed to predict drought and flood conditions in California.
During their three-week voyage, the Ronald H. Brown instruments observed two atmospheric river events. ACAPEX’s air component lasted a few weeks longer, including research flights well inland above California’s Sierra Nevada.
In a triumph of coordination, the ship and all four aircraft rendezvoused off the coast of California to observe one event on February 5, 2015. The next day, the atmospheric river made landfall.
In a March 2016 ARM report on ACAPEX, principal investigator L. Ruby Leung of Pacific Northwest National Laboratory called it “the most observed atmospheric river to date.”
Because of ACAPEX, she says, scientists better understand “how aerosols, such as dust and particles emitted from the ocean surface, affect atmospheric river precipitation.”
A January 2023 paper co-authored by Leung in the journal Nature Climate Change concludes that by the middle of the 21st century, the highest-intensity atmospheric river-related storms could increase by 40% across coastal regions of the western United States.
The modeled increases are linked to projected bigger areas of precipitation, increased storm intensity, and storm “sharpening,” a term for a larger increase of precipitation at a storm’s center.
The model in the January 2023 paper does not use data from the 2015 campaign, says Leung, “but the new study can be considered a follow-on to ACAPEX.”
MARCUS on the Southern Ocean
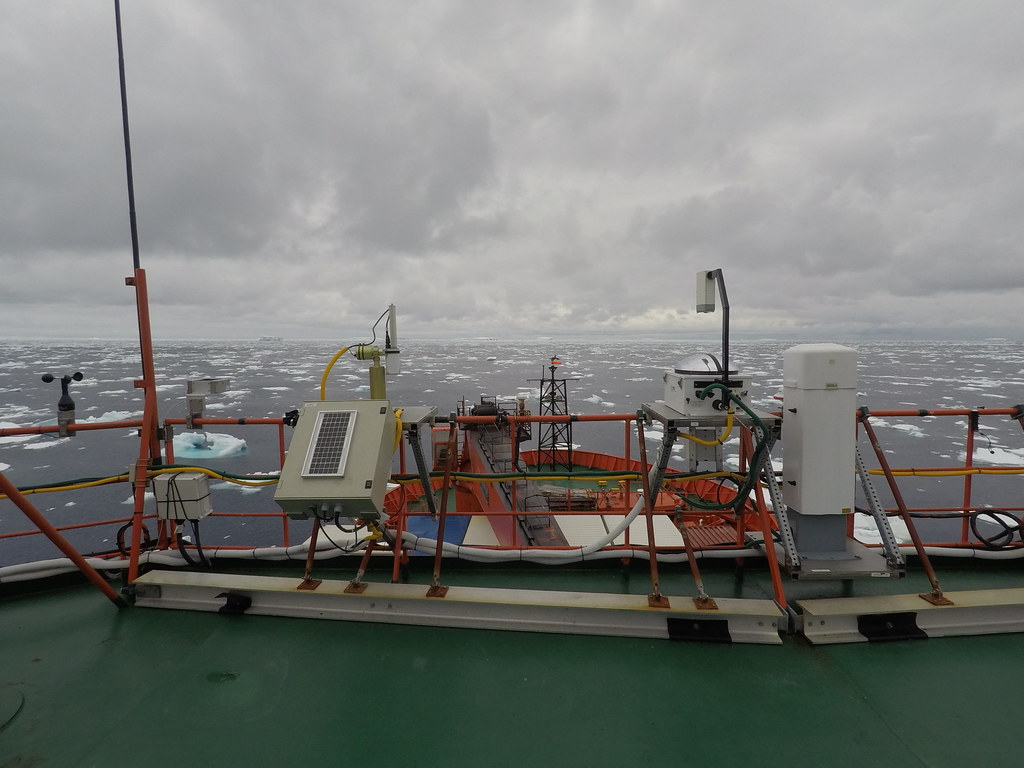
One ARM shipborne campaign took place in the world’s most remote marine environment: Measurements of Aerosols, Radiation, and Clouds over the Southern Ocean (MARCUS), which spanned six months during 2017 and 2018.
MARCUS targeted atmospheric processes above the cloud-sheathed Southern Ocean, the stormiest water body on Earth. Violent waves there can spike 10 meters (33 feet) high. Winds can hit a paint-stripping 150 kilometers (93 miles) an hour. Ships traversing such seas can expect rolls of 45 degrees―halfway to being perpendicular to the ocean surface.
The Southern Ocean swirls around Antarctica, a popular continental science proxy for conditions on Mars. It is the only ocean on Earth not blocked by land and connects all the world’s other oceans by distributing heat, nutrients, and salt.
Understandably, data from the surface of such an ocean―its atmospheric properties, radiative cloud properties, biogenic aerosols, and more―are scant. What happens on the Southern Ocean represents “one of the biggest uncertainties” in earth system models, says MARCUS Principal Investigator Greg McFarquhar.
ARM mounted its instruments on the decks of the supply ship Aurora Australis, based in Hobart, Australia. Decommissioned in 2020, the ship was a blunt-profile, anvil-like brute about 95 meters (311 feet) long and the color of boiled lobster. It crushed through any sea ice in its path.
The ship’s regular 3,500-kilometer (2,175-mile) supply runs to three research stations in Antarctica made it possible to deploy instruments that had been rarely or never used on the Southern Ocean.
Starting in October 2017, MARCUS went on to collect more data on the Southern Ocean atmosphere than any other of three observational studies going back to 1993.
Like other ARM investigators, McFarquhar looks at field campaigns as part of a larger matrix of inquiries. A 2021 summary paper he led discussed MARCUS in the context of three other recent investigations in the same region.
“The data from MARCUS have been very helpful in learning more about cloud, precipitation, and cloud-aerosol interactions over the Southern Ocean,” says McFarquhar. “With the availability of a new icebreaker Nuyina from the Australian Antarctic Division, it is hoped that there will be another opportunity to collect more data over the Southern Ocean.”
The Majesty of MOSAiC
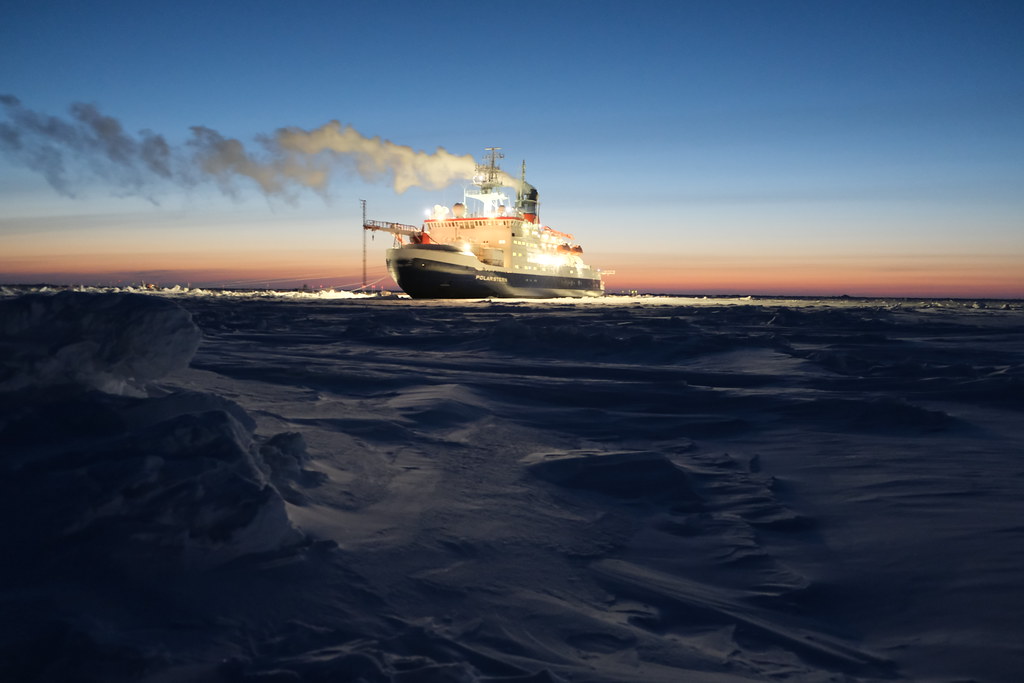
With some help from DOE and ARM, a 2019–2020 international expedition called the Multidisciplinary Drifting Observatory for the Study of Arctic Climate (MOSAiC) created a treasure trove of data sets.
As with SHEBA, a research icebreaker froze into Arctic Ocean sea ice and collected measurements while drifting for a year.
DOE was the German-led expedition’s earliest funder in the world, says Shupe, MOSAiC’s co-organizer.
Shupe was also the principal investigator for ARM’s MOSAiC deployment. More than 50 ARM instruments drew in what he says are “some of the most impactful data” from MOSAiC―a year of atmospheric measurements in the central Arctic.
Those data include breakthrough measurements of arctic aerosol properties. A June 2022 paper in Nature Communications is just one example.
MOSAiC is the latest, biggest example of ARM’s commitment to fieldwork on the open ocean.
ARM operates no ships of its own. That means making “good use of existing networks and potential partnerships,” says Mather. “We definitely want data from that ocean environment, so we get on ships when we can.”
Follow Us:


Keep up with the Atmospheric Observer
Updates on ARM news, events, and opportunities delivered to your inbox
ARM User Profile
ARM welcomes users from all institutions and nations. A free ARM user account is needed to access ARM data.


