

SAIL at 1 Year: A Mountain Hydrology Campaign Sweeps Up Rich Data
Published: 27 September 2022
With 9 months of observation to go, researchers await additional surprises in the Rockies
More than 60% of the world’s fresh water originates in mountain ranges as runoff from precipitation and snowpack. Mountains are water sources so capacious and powerful they are called the water towers of the world.
Yet earth system models are unable to predict when such water will appear and how much there will be. Models of mountain hydrology are limited in part because there are so few routine observations of atmospheric processes and land-surface interactions.
A mountain range’s hills, valleys, steep ridges, brush, forest cover, and weather hazards make getting to such places hard. It is also hard to deploy instruments robust enough to operate across all seasons in high country.
The other big challenge to modeling mountainous systems is that the processes and interactions are more complex over such varied terrain. For example, some of the simplifying assumptions a modeler can make about the atmospheric boundary layer over flat ground do not apply over mountainous terrain.
To add urgency, a kind of world clock is ticking. Globally, higher elevations are warming even faster than lower elevations. There may soon be less snow, less snowmelt, and altered atmospheric conditions. Collectively, all this spells a likely decline in downstream water resources.
At a moment like this, science needs to put many instruments together at the same time―and then use all that data density to build better models.
To the rescue: the Surface Atmosphere Integrated Field Laboratory (SAIL) field campaign.
As of September 2022, SAIL has already been underway for a year in the East River Watershed near Crested Butte, Colorado. The watershed spans 300 square kilometers (186 square miles) of complex terrain.
Setting SAIL
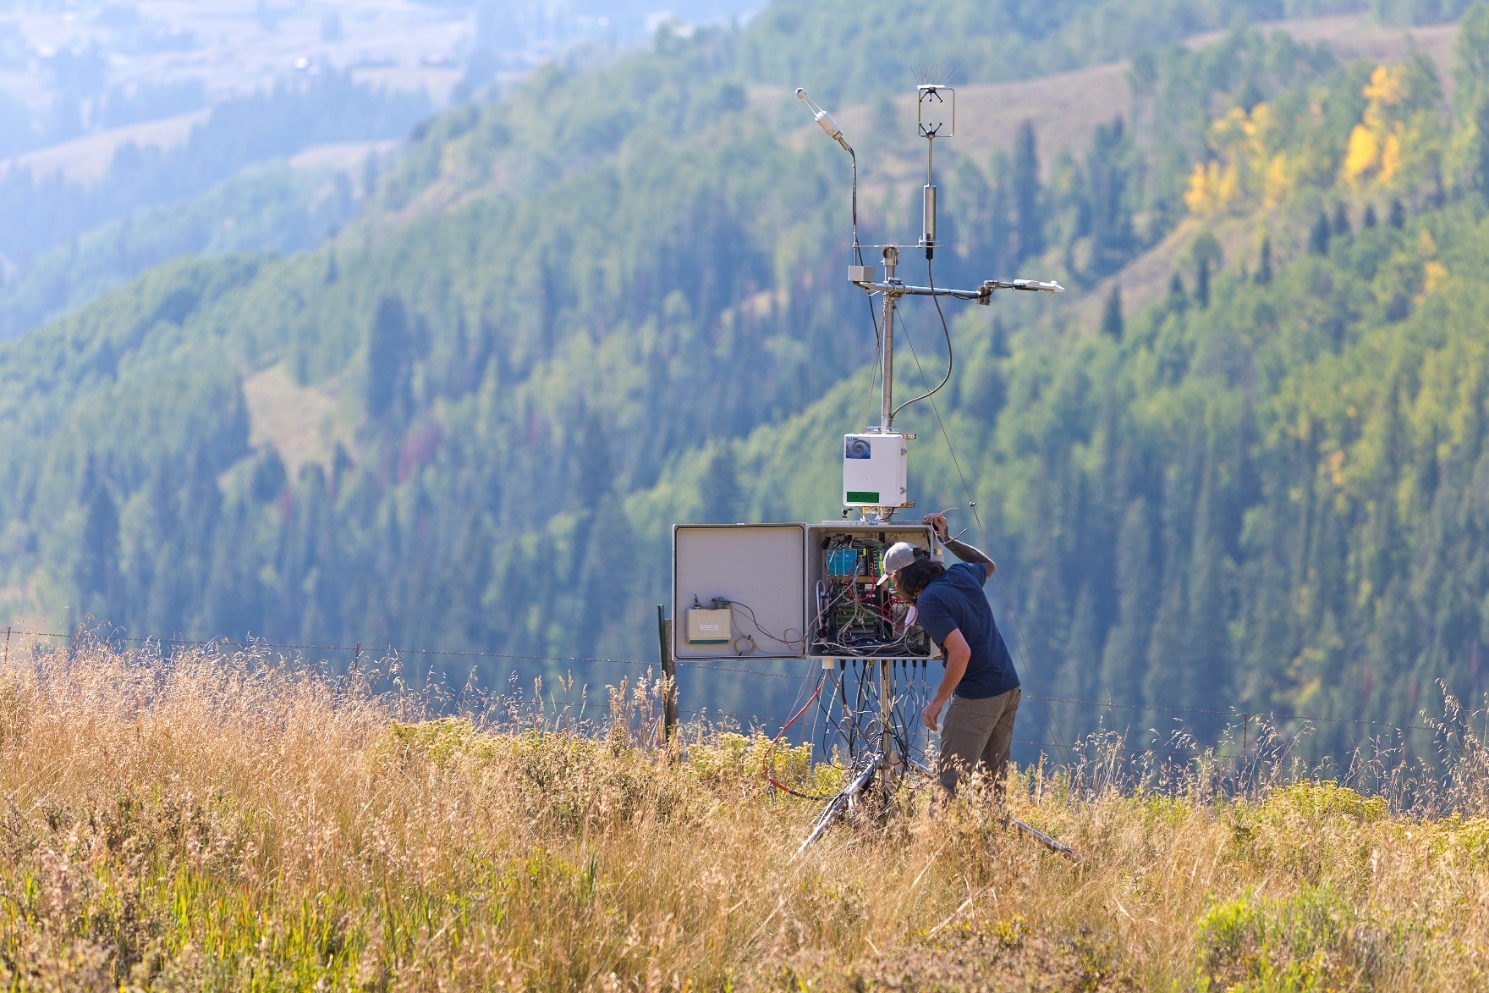
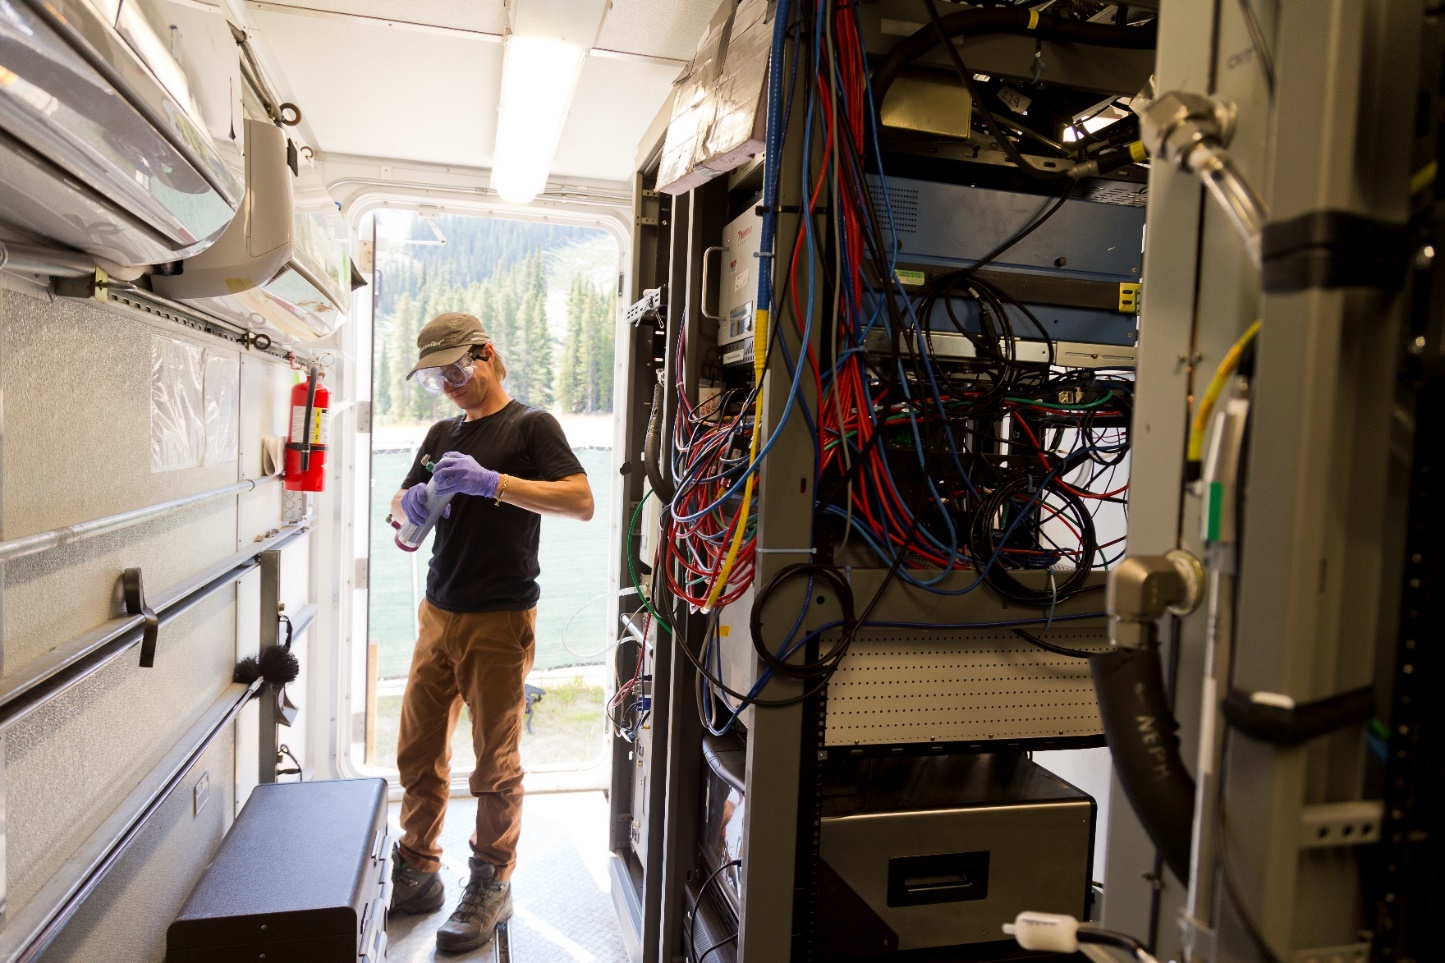
Starting in September 2021, SAIL researchers began taking elaborate atmospheric and surface measurements in this Rocky Mountain watershed. They did so, in large part, with instruments from the U.S. Department of Energy’s (DOE’s) Atmospheric Radiation Measurement (ARM) user facility.
SAIL is slated to close operations in June 2023. In time, its data—some of which are already freely available from ARM—will fill in knowledge gaps about how well models simulate mountain hydrology.
At SAIL’s helm is Daniel Feldman, a scientist at Lawrence Berkeley National Laboratory in California. Feldman has support from DOE’s Atmospheric System Research (ASR) program for SAIL leadership and outreach activities.
With him is a multidisciplinary team: atmospheric scientists, chemists, geologists, and, of course, hydrologists.
SAIL’s closest partner is the DOE-funded Watershed Function Scientific Focus Area (SFA), which is co-located in the East River Watershed.
The SFA has led field studies in the Upper Colorado River since 2014. It supports dozens of researchers with the expertise needed to take measurements from the bedrock to the top of the vegetative canopy.
A Growing SAIL Community
SAIL also has a long-standing partnership with the Rocky Mountain Biological Laboratory (RMBL) in Gothic, Colorado.
In addition, two other major campaigns are joining SAIL. NOAA leads the ongoing Study of Precipitation, the Lower Atmosphere and Surface for Hydrometeorology (SPLASH). The National Science Foundation’s Sublimation of Snow (SOS) campaign will start in November 2022.
Other SAIL partners include additional federal agencies, five other national labs, and more than 10 universities. These partners are drawn to the density of observations and opportunities for science that SAIL brings.
Then there are SAIL guest instruments. They will provide complementary radar measurements, data on water vapor isotopes, and snow images. All this will add rich data on the dominant processes that affect mountain hydrology in the Upper Colorado River Basin.
SAIL and Scale
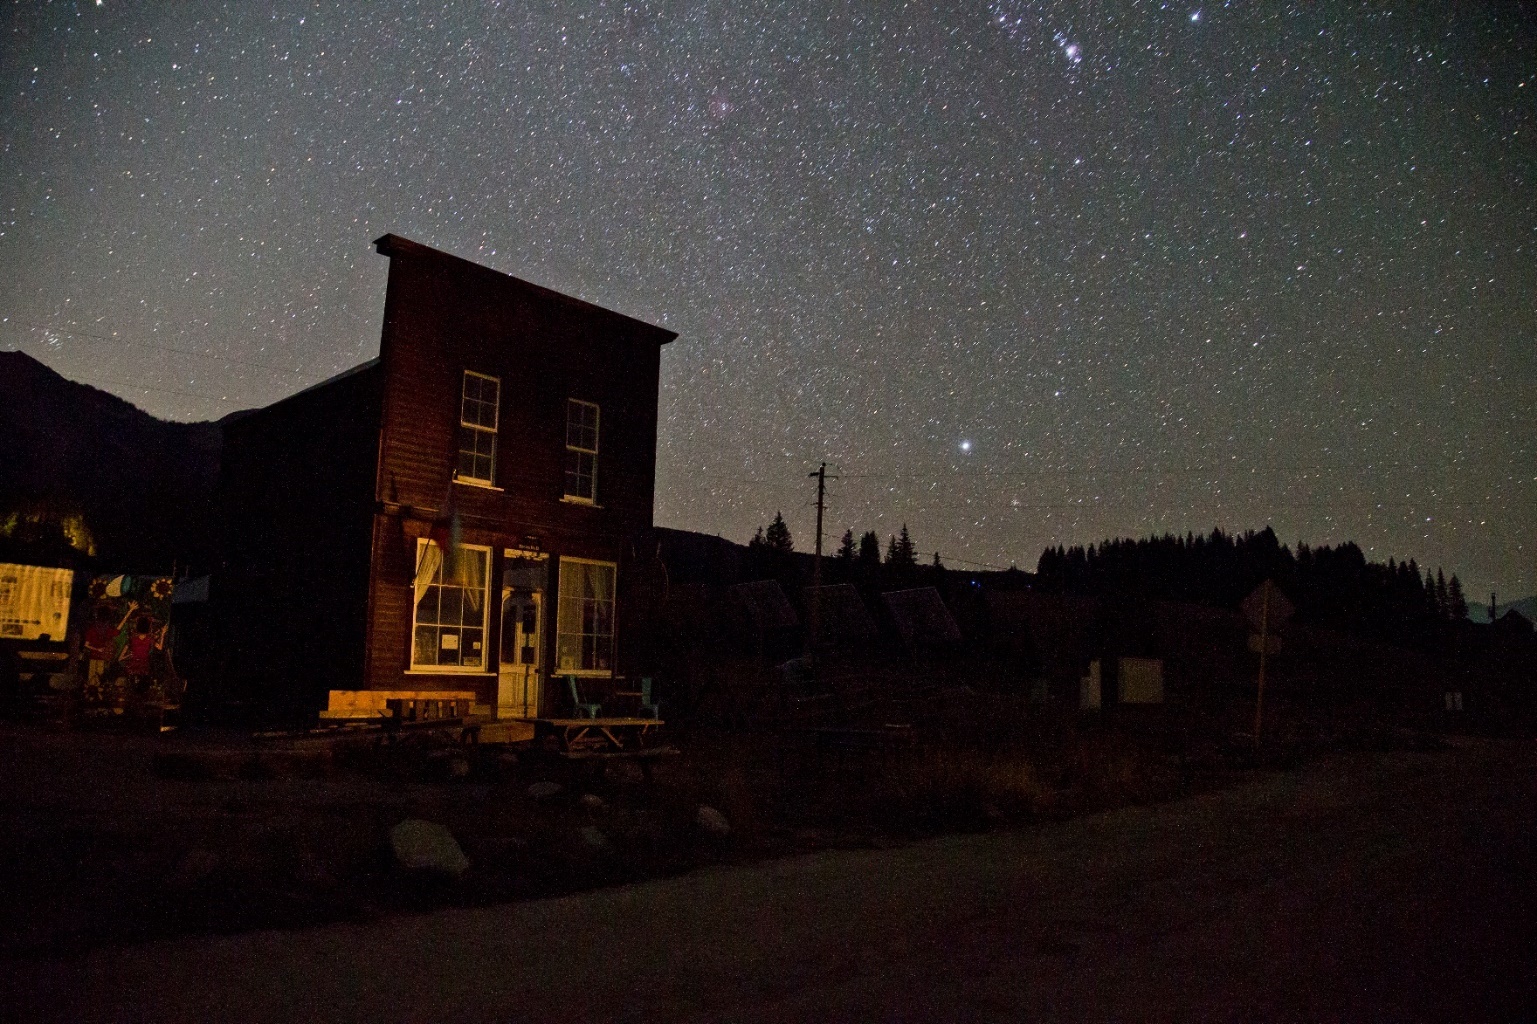
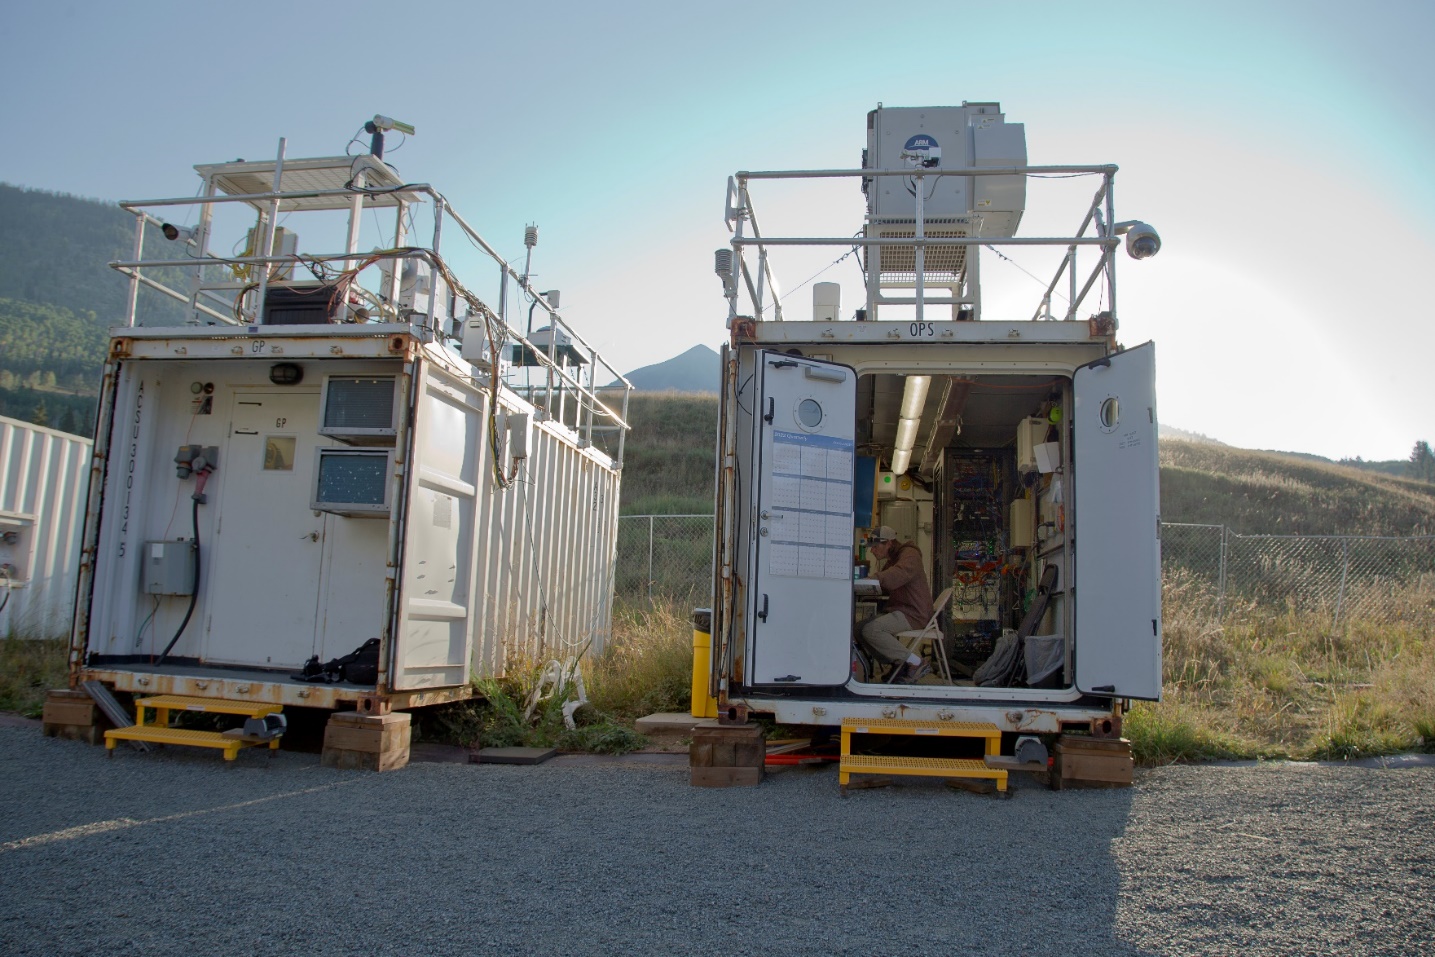
SAIL’s main instrument site is in Gothic, an old mining town based in a mountain valley.
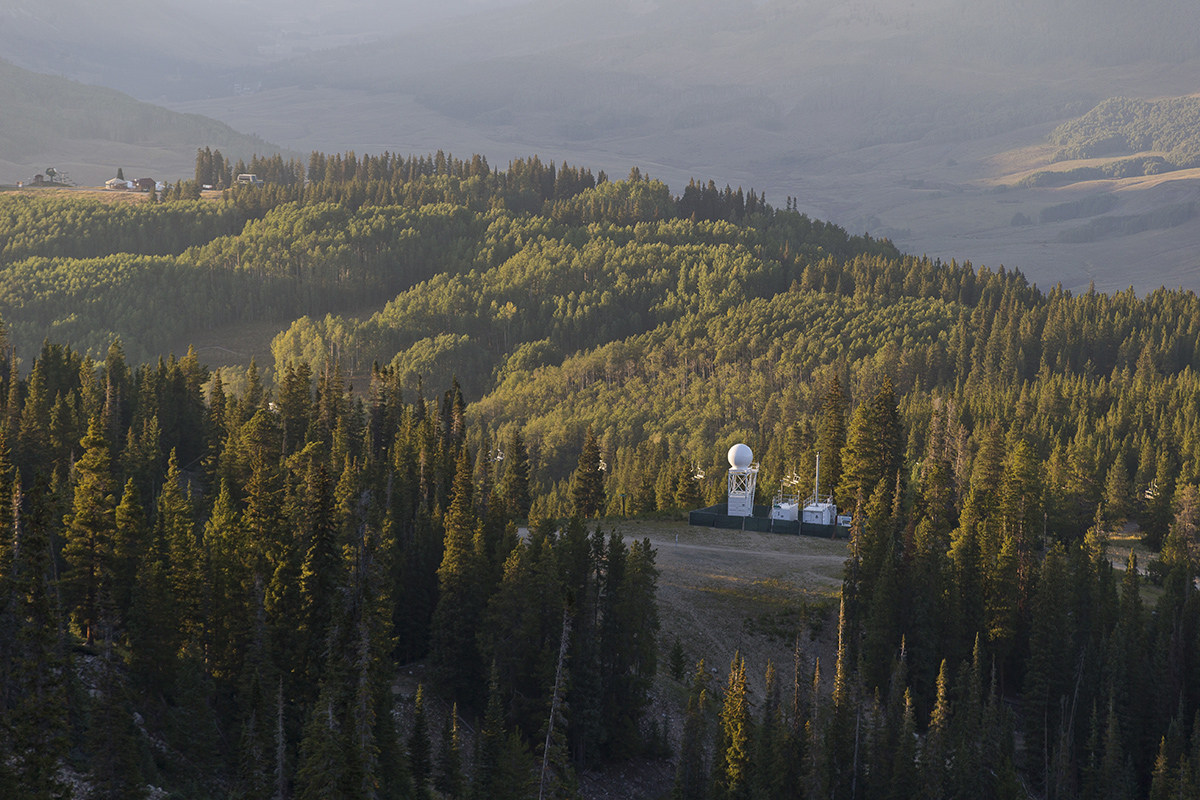
There is a satellite site at Crested Butte Mountain Resort, where ARM’s Aerosol Observing System samples long-range air transport. From the same commanding view over the East River Watershed, an X-band radar from Colorado State University collects precipitation data.
SAIL’s instruments are configured optimally for advancing mountainous hydrology. But scale is a perennial issue for research in the mountains.
The typical earth system model has a grid cell of around 100 kilometers (62 miles). However, the scale at which hydrological processes occur at the surface and in the subsurface range from 1 kilometer (two-thirds of a mile) to 10 meters (33 feet), about half the length of a tennis court.
“How do you go from SAIL data to a grid box or mountain range in E3SM?” asks Feldman, referring to DOE’s high-resolution Energy Exascale Earth System Model (E3SM). “That’s definitely the big question.”
‘Hints of How to Do This’
Feldman says you overcome the issue of scale by:
- looking at the processes that matter the most for integrated mountainous hydrology from the SAIL data
- determining whether the fine-scale features measured by SAIL can be approximated at coarse scales
- evaluating how models such as E3SM represent those processes at their scales.
“Better models will arise from the data.”
He offers an example: SAIL’s acute interest in precipitation. How is it a measure of how much water is available in the East River Watershed?
Such a series of precipitation observations, says Feldman, can help SAIL researchers answer questions like these:
- How does precipitation vary across terrain?
- How does it increase with elevation?
- Why does it increase more with elevation in some places than in others?
SAIL data are also sensitive to processes that affect snow, aerosols, and the surface energy budget. All of these are key values for what mountainous hydrology modelers require.
“Better models will arise from the data,” says Feldman.
So will getting answers to the questions that persistently frustrate better predictions of how much water will come out of the Upper Colorado River.
“We are seeing hints of how to do this in the data,” adds Feldman. “Touch wood.”
Water Years
Feldman talks in terms of Rocky Mountain “water years.” A water year begins in October, like a fiscal year.
The water year before SAIL began was exceptionally dry―one so parched “that it was highly motivating for us scientifically,” he says. “We were definitely concerned about the changing landscape of water resources in the Colorado River Basin.”
The Colorado River supplies water to 40 million people in seven Western states and creates $1 trillion a year in economic activity, including hydropower.
The water year leading up to SAIL started out in a good place. Winter 2020–2021 precipitation was just slightly below average. Yet by April 2021, the outlook looked dire―then things went even further downhill. Severely dry conditions gripped the states that depend on the Colorado River as a freshwater spigot.
“A record low discharge (was happening) in the middle of an average precipitation year,” says Feldman. “Where was the water going?”
Thus, SAIL began with a mystery. From that point, researchers were eager to find what Feldman called water’s “loss pathways” and to find out which ones were more important than the others.
The year of lost water, says Feldman, set the stage for SAIL “going high into the Rockies and deploying a set of very detailed observations.”
The Winter That Almost Wasn’t
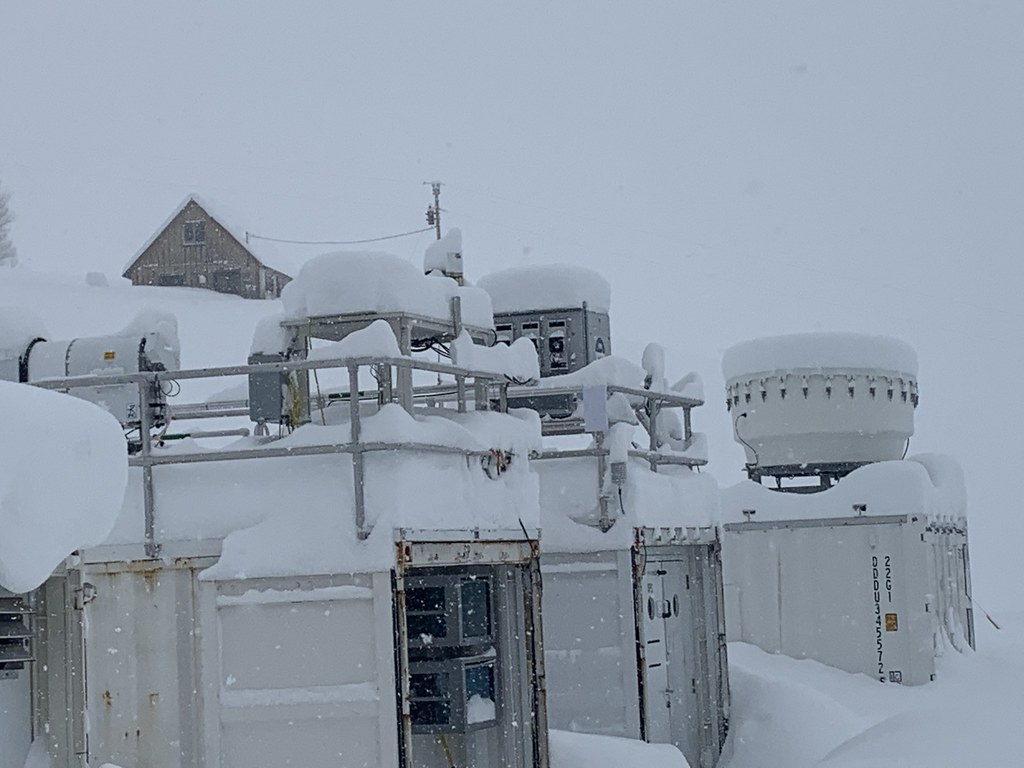
In late 2021, after meteorological winter began December 1, “I was nervous. Very nervous,” says Feldman. “We had one of the driest falls and early winters on record.”
Then came December 20: the start of what Coloradans call “the Santa Slammer,” when 100 inches of snow fell in just a few days. That’s about half the snowfall in an average year.
The storm changed the tenor of discussions about water and the winter season “quite dramatically,” says Feldman.
With so much snow on hand, SAIL researchers could look at the spatial variability of the snowfall, he adds. “Is there more here or there? Why is that happening? Pretty exciting.”
When Snow Sublimates
During the rest of the winter, there were times with a lot of snowpack on the ground but little precipitation in the air.
For SAIL, that was an opportunity to look at the evolution of the snowpack, including processes that create uncertain water projections.
One of those processes is snow sublimation, which Feldman had earlier earmarked as one of the potential culprits in the water crisis that unfolded in 2020 and 2021.
He compared it to how ice cubes in the freezer shrink over time. Snow sublimation occurs when frozen water turns directly to vapor, sidestepping the liquid phase entirely. The process is likely a common way for snow to disappear in mountain terrain before creating any water.
Sublimation affects snowpack, snow in the trees, and snow blowing around, but is exceedingly hard to measure or estimate.
The SAIL team can get past these challenges by looking at them “through the lens of science opportunities,” says Feldman. “We have lots of datastreams,” including some that will inform how models represent sublimation.
Aloft, a View of Spring
SAIL witnessed “a very dusty and a very windy spring,” says Feldman.
That’s not a complaint, he adds, because both conditions “allow us to understand how the atmosphere is forcing a transition from a snow-dominated environment to one that is completely snow-free.”
That transition can happen very quickly, says Feldman. “We’re looking forward to really diving into it in more detail.”
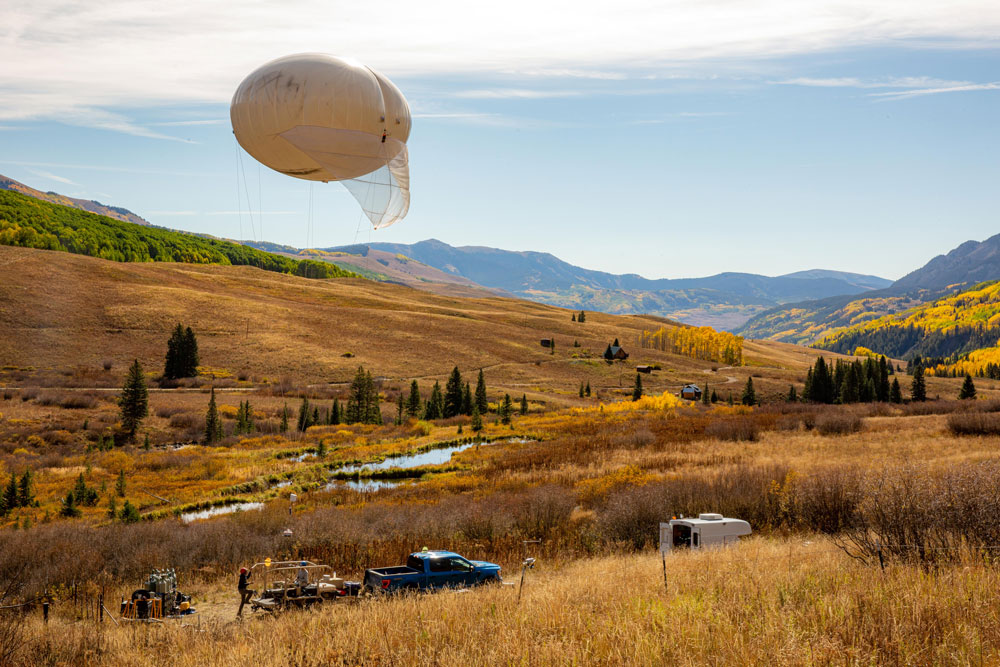
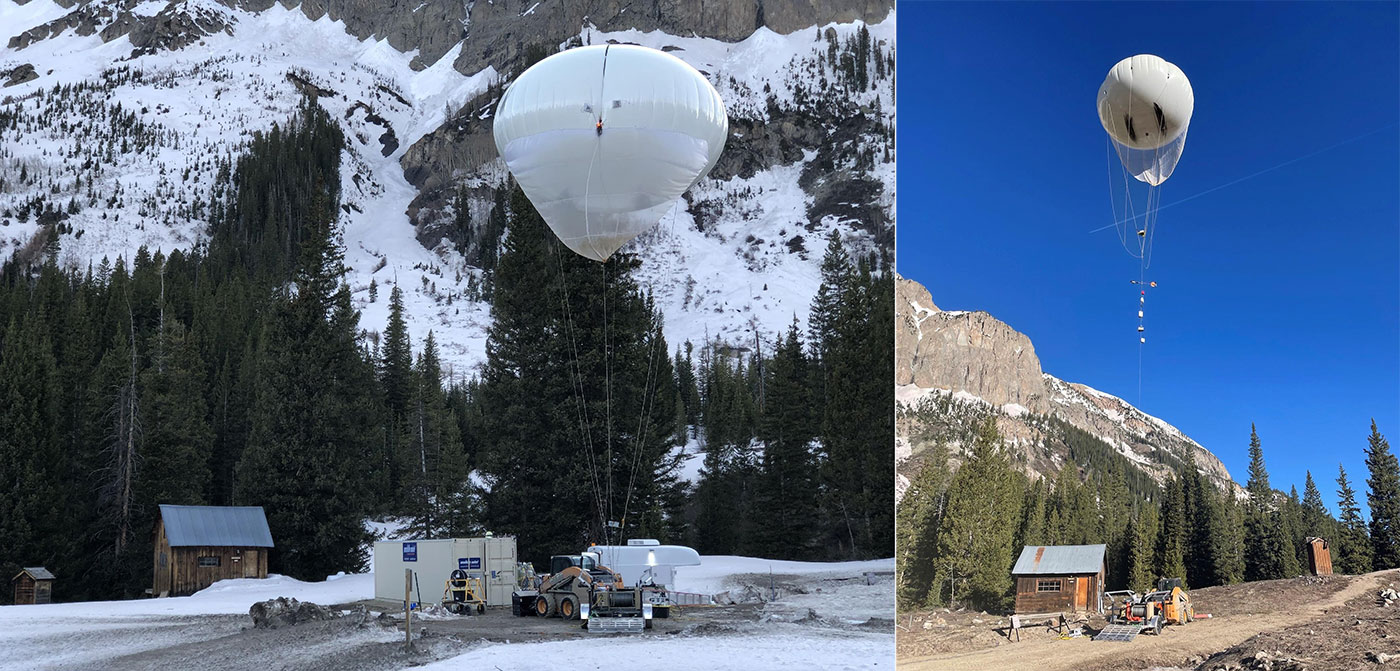
In April 2022, a tethered balloon system (TBS) crew arrived, led by Dari Dexheimer at Sandia National Laboratories in New Mexico. The crew’s mission was to collect aerial observations of the vertical structure of temperature, humidity, and aerosols in the planetary boundary layer.
The first SAIL TBS deployment happened in September 2021. Conditions in April and May 2022 were much different and provided valuable contrasts. The TBS crew had to cease operations after a couple of days because of high winds. But when the TBS went back into action, winds gave way to unexpected snow. Then that quickly gave way to warmer weather, allowing the capture of valuable data on the snow-to-spring transition.
Summer Monsoons
And the SAIL summer of 2022? Feldman describes it as “pretty wild.”
Monsoon rains were so heavy, he says, “we’re still trying to get our brains around it. Storm after storm, practically every single day.”
So much rain “has been really nice for water resources,” says Feldman. “It also allows us to build up statistics on how the atmosphere evolves over the course of the day,” from hot morning sun to afternoon rain.
During its 21-month lifespan, SAIL will collect data across two autumns, two winters, two springs, and one summer.
That length of time, says Feldman, “allows us to address questions of interannual variability, in ways we would not be able to do otherwise.”
It also allows researchers to record both transitory mountain-terrain events, like storms, and processes that are stationary from year to year.
“We have this long runway,” says Feldman of SAIL. “Mother Nature has told us many stories and will be telling us many more.”
Follow Us:


Keep up with the Atmospheric Observer
Updates on ARM news, events, and opportunities delivered to your inbox
ARM User Profile
ARM welcomes users from all institutions and nations. A free ARM user account is needed to access ARM data.


