

Dust in the Wind at SAIL
Published: 28 July 2022
Editor’s note: Daniel Feldman, the principal investigator for the Surface Atmosphere Integrated Field Laboratory (SAIL) campaign in Colorado, provided the following blog post with contributions from SAIL co-investigators Ken Williams, Allison Aiken, S. McKenzie Skiles, and Jeff Deems.
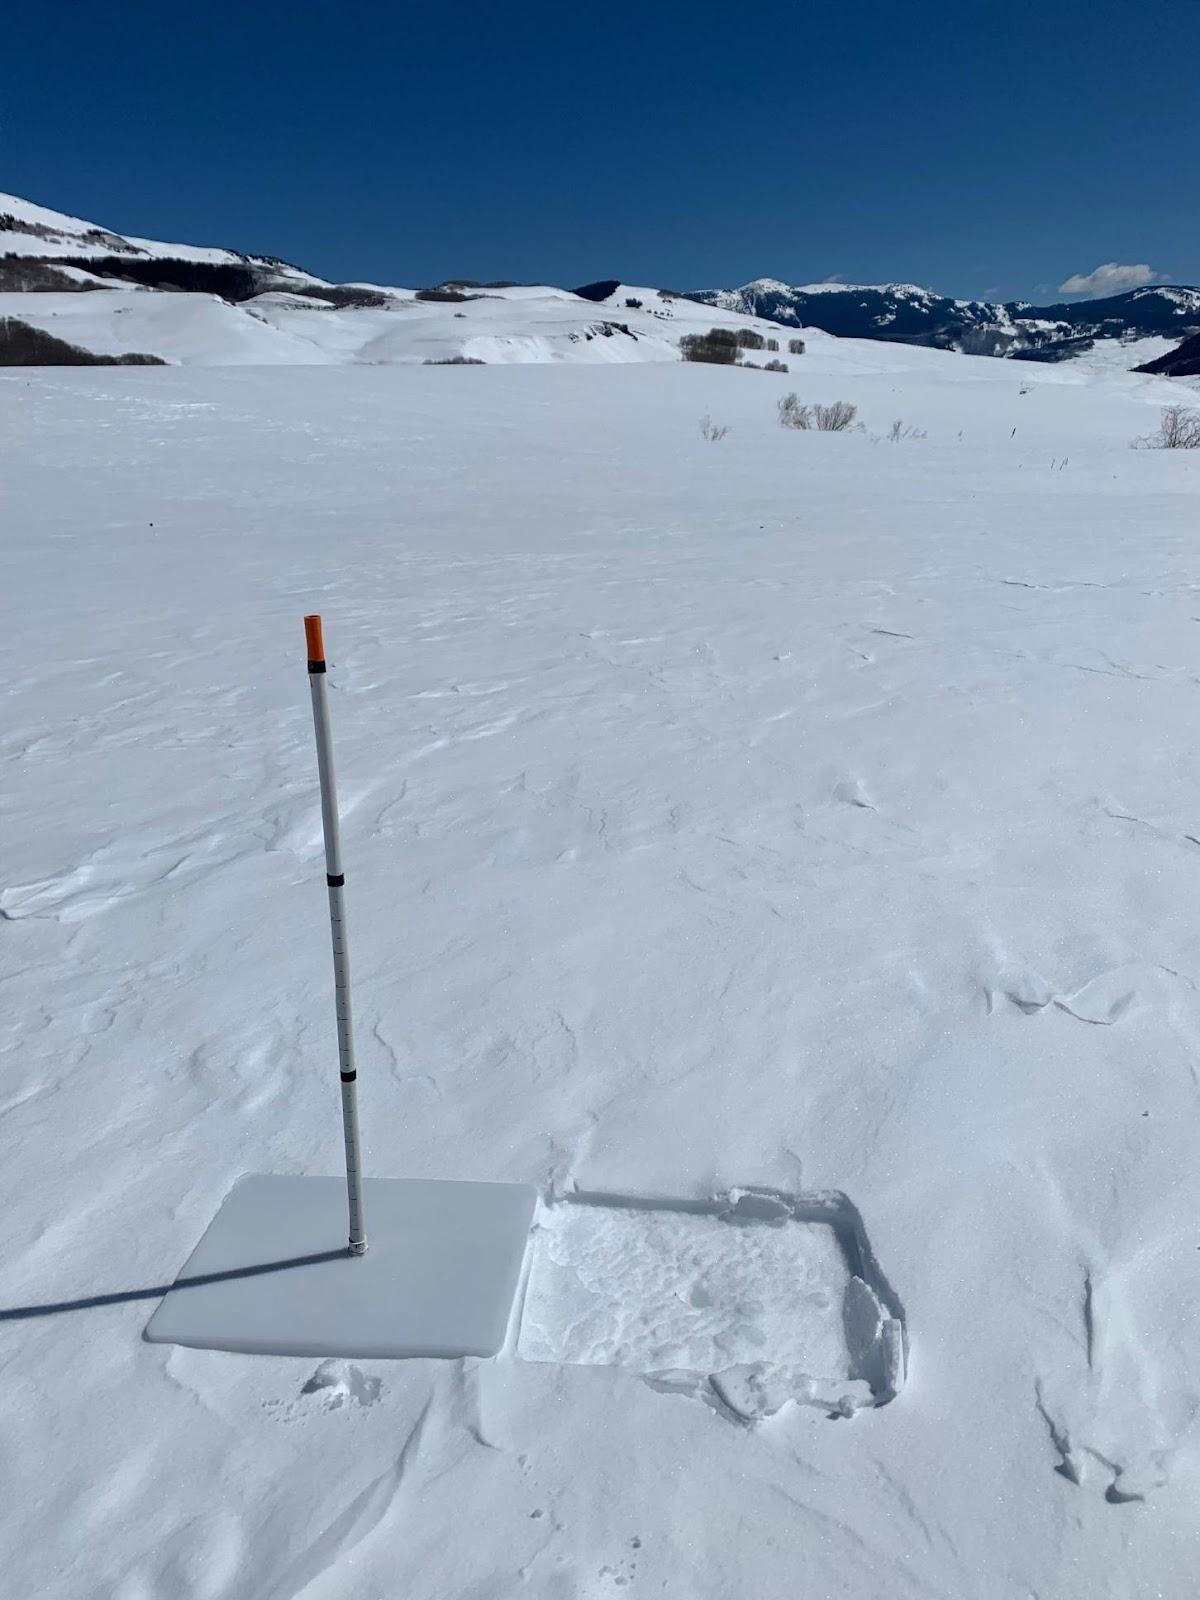
The seasonal changes in the Colorado Rocky Mountains are so dramatic that it is scarcely possible to imagine a pleasant summer in the depths of winter. The thoughts of lounging outside in the heat seem quite distant when the temperature is routinely below 0 F. But between the frigid winter and the glorious summer, the spring transition always occurs.
The meters of snowpack all melt during a time the locals affectionately (or perhaps tongue-in-cheek) call “mud season.” The spring is slushy, the snow is dirty and patchy, the mud is sticky and slippery, and tourists are—for a time anyway—in short supply.
At the same time, this transition period is incredibly important for water resource management. When and where the snow melts determines both who and what can use it and how much water makes its way down into streams, rivers, and reservoirs. A number of atmospheric processes dominate this melt: Increased solar radiation and temperatures work together with dust and other aerosols to melt the snow.
In 2021/2022, the Rockies experienced a winter full of weather whiplashes. The total snow accumulation was about average relative to the 30-year climatology from 1991–2020, but it set the stage for the main water resource event, and provided a prime opportunity to test the scientific community’s understanding of the spring transition.
It may come as a surprise to learn that before 2022, ARM, with its hundreds of field campaigns worldwide, had yet to measure the full spring melt in high-altitude complex terrain. That has now changed: SAIL collected observations in the Crested Butte, Colorado, area this past spring and has stories to tell!
While the total precipitation for winter 2021/2022 was close to the climatological average, the spring melt was anything but typical. The atmosphere forced the snowpack with all the subtlety of a Mack truck. This was one of the dustiest springs of the last 10 years across the Rockies, and for Colorado, one of the windiest ever recorded.
The late winter and early spring snowfall blunted some, but not all, of the dust’s effects on snow.
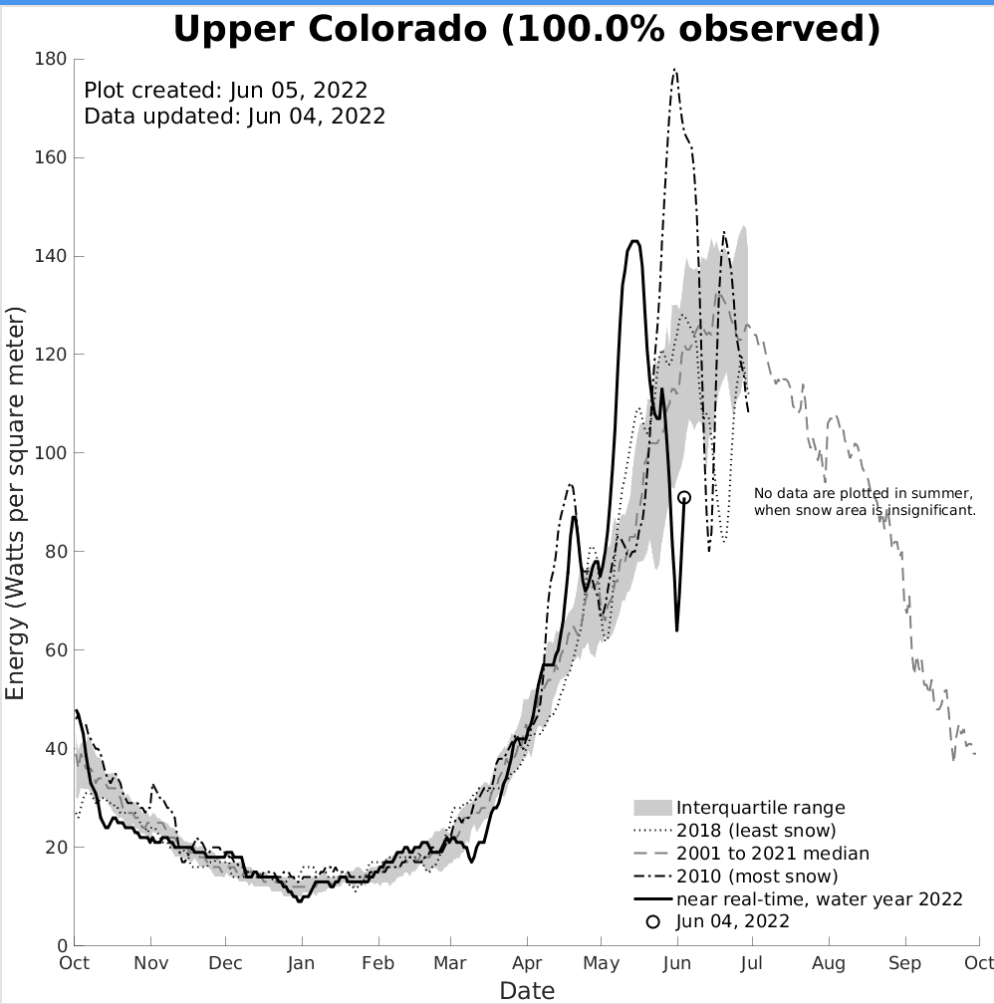
SAIL data show exactly how atmosphere and surface properties are related in the East River Watershed this past spring. Dozens of ARM instruments observed how much solar and thermal energy flowed into the snowpack to drive its melt, how dust made its way from the atmosphere to the surface, the wind patterns throughout the watershed, and where precipitation was and was not occurring that might mask the dust.
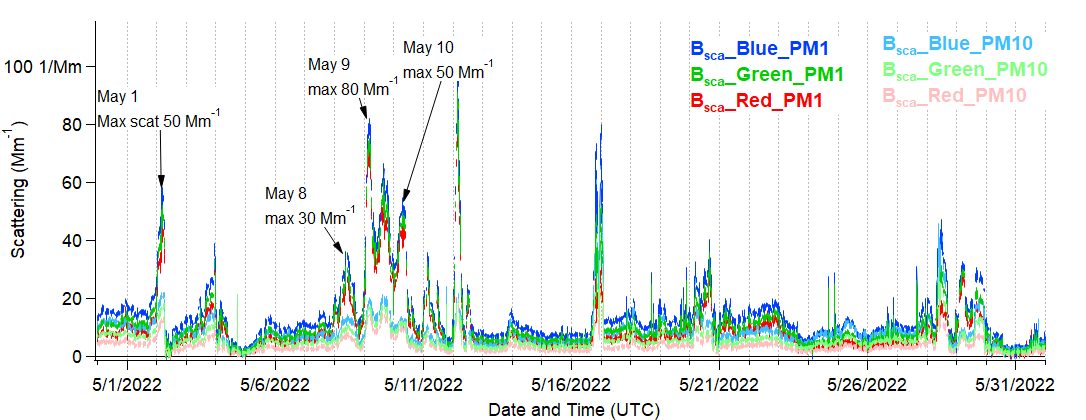
Aerosol Observing System instruments measured several large dust events in May, as shown with high particulate scattering in the supermicron size range. Additional analysis revealed that wind trajectories brought in smoke from wildfires in northern Arizona.
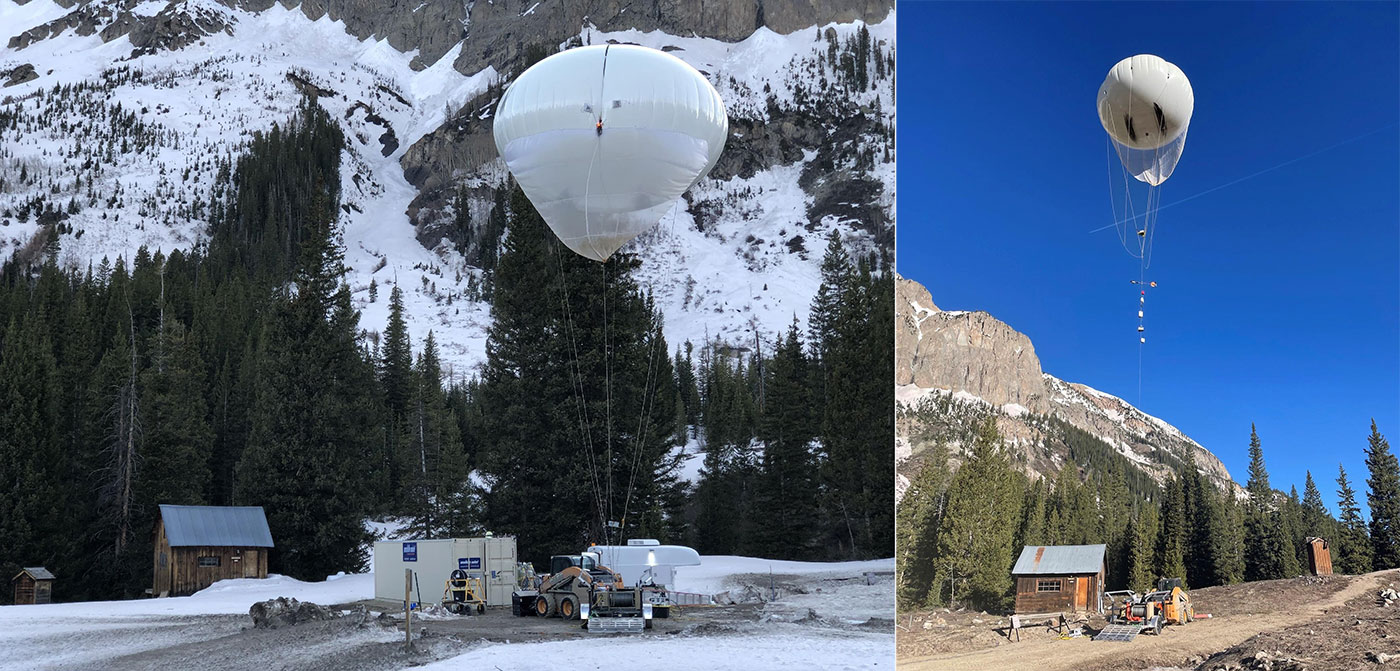
ARM also deployed a key aerial asset to SAIL: the tethered balloon system. Test flights in early May showed the tenuous nature of the snowpack. Vertically resolved measurements of aerosols also highlighted where dust was most concentrated in the atmosphere.
The ASR-funded SAIL-Net project is collecting data to establish spatial and elevational gradients in surface aerosols, while DOE’s Watershed Function Science Focus Area is tracking the snowpack and its discharge.
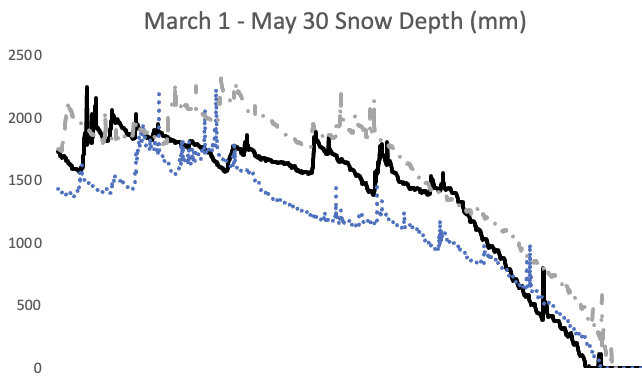
Snow surveys from the Airborne Snow Observatory captured the distribution of snow depth, snow-water equivalent, snow albedo, and dust radiative forcing of the snowpack on April 21 and May 18. About half the snowpack remained in the watershed on the latter date, in spite of having little to no snow at lower elevations.
Together, SAIL and partners have stories of this wild spring, but the data surely contain many more stories yet to be uncovered from this “mud season” in the Rockies.
Follow Us:


Keep up with the Atmospheric Observer
Updates on ARM news, events, and opportunities delivered to your inbox
ARM User Profile
ARM welcomes users from all institutions and nations. A free ARM user account is needed to access ARM data.


