

ARM’s Decadal Vision, Part 2: Data Analytics
Published: 22 February 2022
ARM has long-term plans to improve data descriptions, internal analyses, and analytical techniques
Editor’s note: This is the second article in a series about the four themes in ARM’s Decadal Vision document.
 After nearly 30 years of continuous data collection worldwide, the Atmospheric Radiation Measurement (ARM) user facility has archived almost 4 petabytes of data on the processes that drive Earth’s climate and weather.
Aiming to amplify this unique store of 24/7 information, ARM recently conducted a yearlong examination of ways to optimally sharpen and broadcast its freely available data.
The result is the 31-page Decadal Vision document, written by ARM Technical Director Jim Mather and published in 2021.
The Decadal Vision is the product of interviews and workshops with veteran users of ARM data. Mather sifted through comments and ideas, organizing them into four aspirational themes. Then he wrote a forward-looking summary of needs and plans for ARM, a U.S. Department of Energy (DOE) Office of Science user facility.
The four themes cover a lot of ground:
- improved data analytics (the subject of this feature)
- expanded field measurements (the subject of a previous ARM feature)
- enhanced data services
- increased usage of ARM data to improve earth system models.
Together, says Mather, the four themes are about “maximizing the science impact of ARM toward DOE goals.”
Characterization and Transparency
The Decadal Vision promises improved descriptions of measurements through data transparency, internal consistency, and analytic enhancements. (Scientists call such descriptions “characterizations.”)
ARM measurements stream from more than 450 instruments designed for land, sea, and air platforms. Without curation, ARM data (or any data) will be underutilized or even misused.
Curation means further characterizing data: assessing its quality, creating higher-order data products, and determining uncertainties in raw data or parameterizations. (Parameterizations are simplified representations of complex processes.)
But too much curation is still left to ARM data users, according to the Decadal Vision document.
“We need to be doing more of this work in-house,” says Mather. “We need to spend more effort on this characterization work (by giving) instrument mentors and data translators more space to grow and innovate.”
In ARM-speak, instrument mentors oversee the sophisticated equipment that observations require.
Data translators are the experts who develop more advanced data products for specific science needs. Translators might provide a best-estimate data set from multiple instruments. Or they might make a data set that is easier for modelers to use.
Freeing Up Team Time
To Mather and others within ARM, more transparency means better communicating to users the details of calibrating instruments and assessing data quality.
That is already happening.
In recent years, ARM has been “transitioning old tools to new software technologies,” says ARM Instrument Operations Manager Adam Theisen, based at Argonne National Laboratory in Illinois. “ARM is already exploring how we can free up more time from our mentor teams to focus on the data. (It) all comes down to streamlining ARM tools and processes.”
ARM is also encouraging its mentors to write papers about their data and instruments, says Theisen.
He gave an example: a published view of ARM’s Aerosol Observing Systems. Janek Uin of Brookhaven National Laboratory in New York led a team of mentors and aerosol experts in writing the 2019 paper.
Meanwhile, says Theisen, ARM data users who have questions or problems can reach out to mentors directly or go to the “Ask Us” and “Data Questions” links. They are at the bottom of the ARM website, under the Help section.
Closure Studies as ‘the Ultimate Test’
Another goal for ARM data analytics is to create more data that are internally self-consistent.
For one, that means encouraging more closure studies. These studies reach “closure” if the observations agree with the predicted rates of a given process or phenomenon within the expected uncertainties.
Having such closure―which means more reliable data―is a boon to modelers. They need recorded observations that reduce uncertainties and sharpen how their simulations predict future conditions.
“Closure studies represent the ultimate test of our predictive understanding. ARM sites have a vast array of instrumentation and measurement capabilities and are in a unique position to allow for such challenging studies.”
Daniel Knopf, Stony Brook University
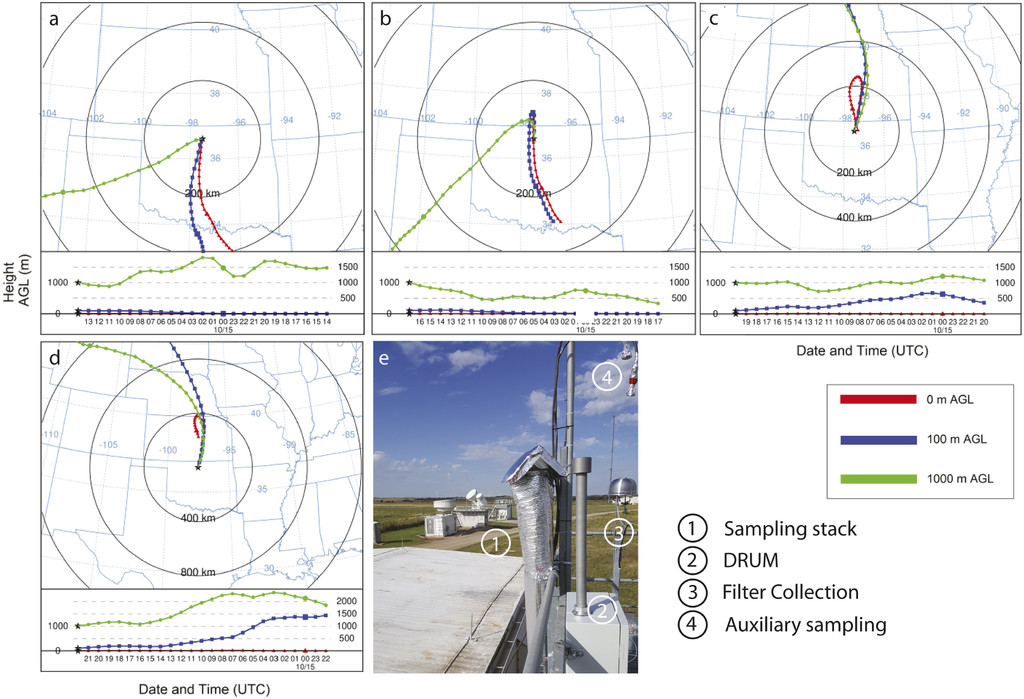
Scientists continue to analyze data from a 2019 closure study supported by DOE’s Atmospheric System Research (ASR). The fieldwork took place at ARM’s Southern Great Plains atmospheric observatory. Leading the study is Daniel Knopf, an aerosol researcher at Stony Brook University in New York.
The aim, outlined in a 2021 paper on preliminary results, was to create closure between observations of ice-nucleating particles and the predicted rates of ice formation by aerosols in ambient air.
This is important to modelers trying to predict rates of cloud formation and precipitation―processes that are influenced by clouds, ice, and aerosols.
Closure studies are one way to analyze groups of related measurements. That’s another Decadal Vision goal.
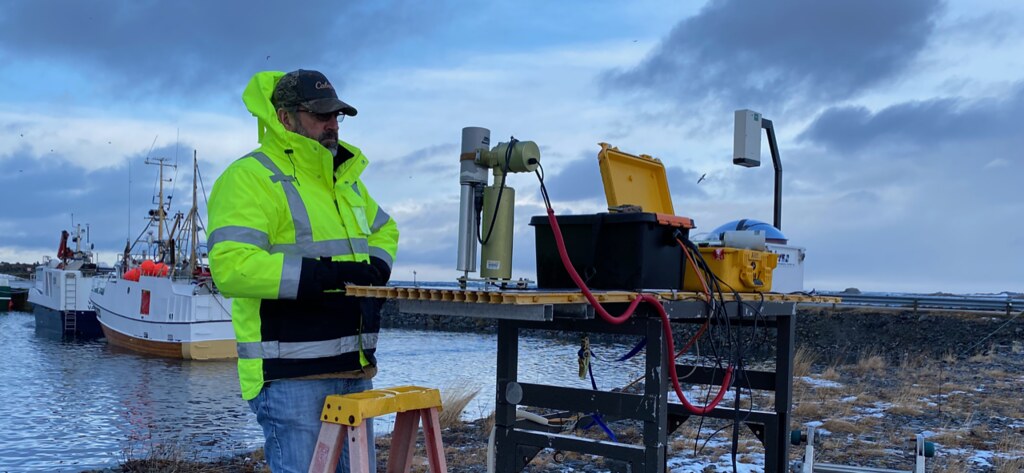
To get closer to closure, ARM has begun to attach miniature aerosol sensors on its tethered balloon systems (TBS). It is also working to add such sensors to uncrewed aerial systems (UAS).
Together, TBS-UAS aerosol measurements could provide more accurate vertical profiles of how aerosol properties evolve as aerosols rise into the atmosphere.
Mather says that an integrated data set from such vertical-column observations would advance aerosol process studies.
Adds Knopf: “Closure studies represent the ultimate test of our predictive understanding. ARM sites have a vast array of instrumentation and measurement capabilities and are in a unique position to allow for such challenging studies.”
Advanced Analytical Techniques
According to the Decadal Vision, ARM will step up its use of sophisticated tools in data analytics, including artificial intelligence (AI).
Machine learning, for instance, can make ARM data more powerful and flexible. Users needing such data assessment are from disparate places, including universities, national laboratories, agencies, and industries.
“Providing comprehensive and consistent assessments is very challenging, and we are currently limited in the degree of assessment we can provide,” says Mather. “Machine learning and artificial intelligence have huge potential to improve this.”
Machine-learning algorithms can also quality-check data right at an instrument itself. Mather says that could “make it possible to identify instrument problems in near-real time.”
Shaocheng Xie is a research scientist at Lawrence Livermore National Laboratory in California and a key voice in the ARM and DOE modeling community. He agrees that machine learning can “help objectively fill in data gaps and identify situations when ARM data may have problems.”
ARM Explorations
ARM is aware of growing interest in AI applications. The user facility issued a 2017 call for projects using machine learning to address data quality and uncertainties.
Xie and a Lawrence Livermore team developed a machine-learning framework for automatically detecting rain contamination in ARM microwave radiometer measurements.

Edward Luke at Brookhaven National Laboratory put together machine-learning algorithms to screen out noise from sea clutter―the kind of wave action in open water that is a problem for scanning radars.
In October 2020, an online workshop brought together members of the ARM/ASR community to explore uses of machine learning, deep learning, and related techniques for streamlining investigations of earth systems and weather.
DOE has stepped up too. A 2020 report summarized opportunities in AI. They include using such methods to assimilate large volumes of continuous observations and to cope with the “complex, coupled, nonlinear systems” like the atmosphere. ARM got a direct mention as part of DOE pioneering “integrated observational capabilities … at field scales.”
In fall 2021, over a five-week period, DOE also sponsored a 17-session workshop on Artificial Intelligence for Earth System Predictability (AI4ESP). A report summarizing the workshop is expected to be released in May 2022.
AI4ESP is housed in DOE’s Earth and Environmental Systems Sciences Division. The initiative’s mission is to develop new ways to enable AI for earth system predictability―in the field and laboratory, as well as in modeling and data-analysis activities.
Workshop sessions drilled into many topics linked to the ARM data mission, including earth system predictability, atmospheric models, clouds and aerosols, and data acquisition and distribution.
The workshop was moderated by ARM Associate Director for Operations Nicki Hickmon from Argonne National Laboratory in Illinois. Speakers and session chairs included climate and water-cycle modeler L. Ruby Leung and atmospheric modeler Po-Lun Ma, both ARM data users; and ARM Data Services Manager Giri Prakash.
AI4ESP had 156 white papers in hand before the workshop. Among ARM-affiliated white papers, a paper co-authored by Prakash, Hickmon, Theisen, and ARM Data Center staff focused on AI upgrades to data centers. The main concern was data interoperability—that is, how to make datastreams interactive in a coordinated way for the efficient exchange of information.
A core team of four started organizing the AI4ESP project in fall 2020. Two are ARM staff: Hickmon and Argonne’s Scott Collis, an ARM translator. Another is Forrest Hoffman, a computational scientist at Oak Ridge National Laboratory in Tennessee who has used ARM data. The fourth member is Haruko Wainwright, who recently moved from Lawrence Berkeley National Laboratory in California to become an assistant professor of nuclear science and engineering at Massachusetts Institute of Technology.
ARM’s hope is that AI4ESP will point to more efficient methods to analyze the data on which models depend. Such data measure a daunting array of atmosphere, land, subsurface, and ocean components in scales from microns to continents.
‘All Kinds of Possibilities’
An increasing number of papers highlight machine-learning approaches that use ARM data or that feature ARM-affiliated researchers.
An October 2020 study used SGP data and machine learning. Scientists sought to quantify the three-dimensional (3D) structure of shallow cumulus clouds. They also wanted to explain the complex variability of the surface solar irradiance beneath these puffy, rain-free clouds. (Surface solar irradiance is a measure of how much energy from the sun reaches the planetary surface.)
The paper’s lead author was Jake Gristey, a NOAA research scientist at the Cooperative Institute for Research in Environmental Sciences in Boulder, Colorado. His two algorithms eliminate the need for computationally expensive 3D radiative calculations.
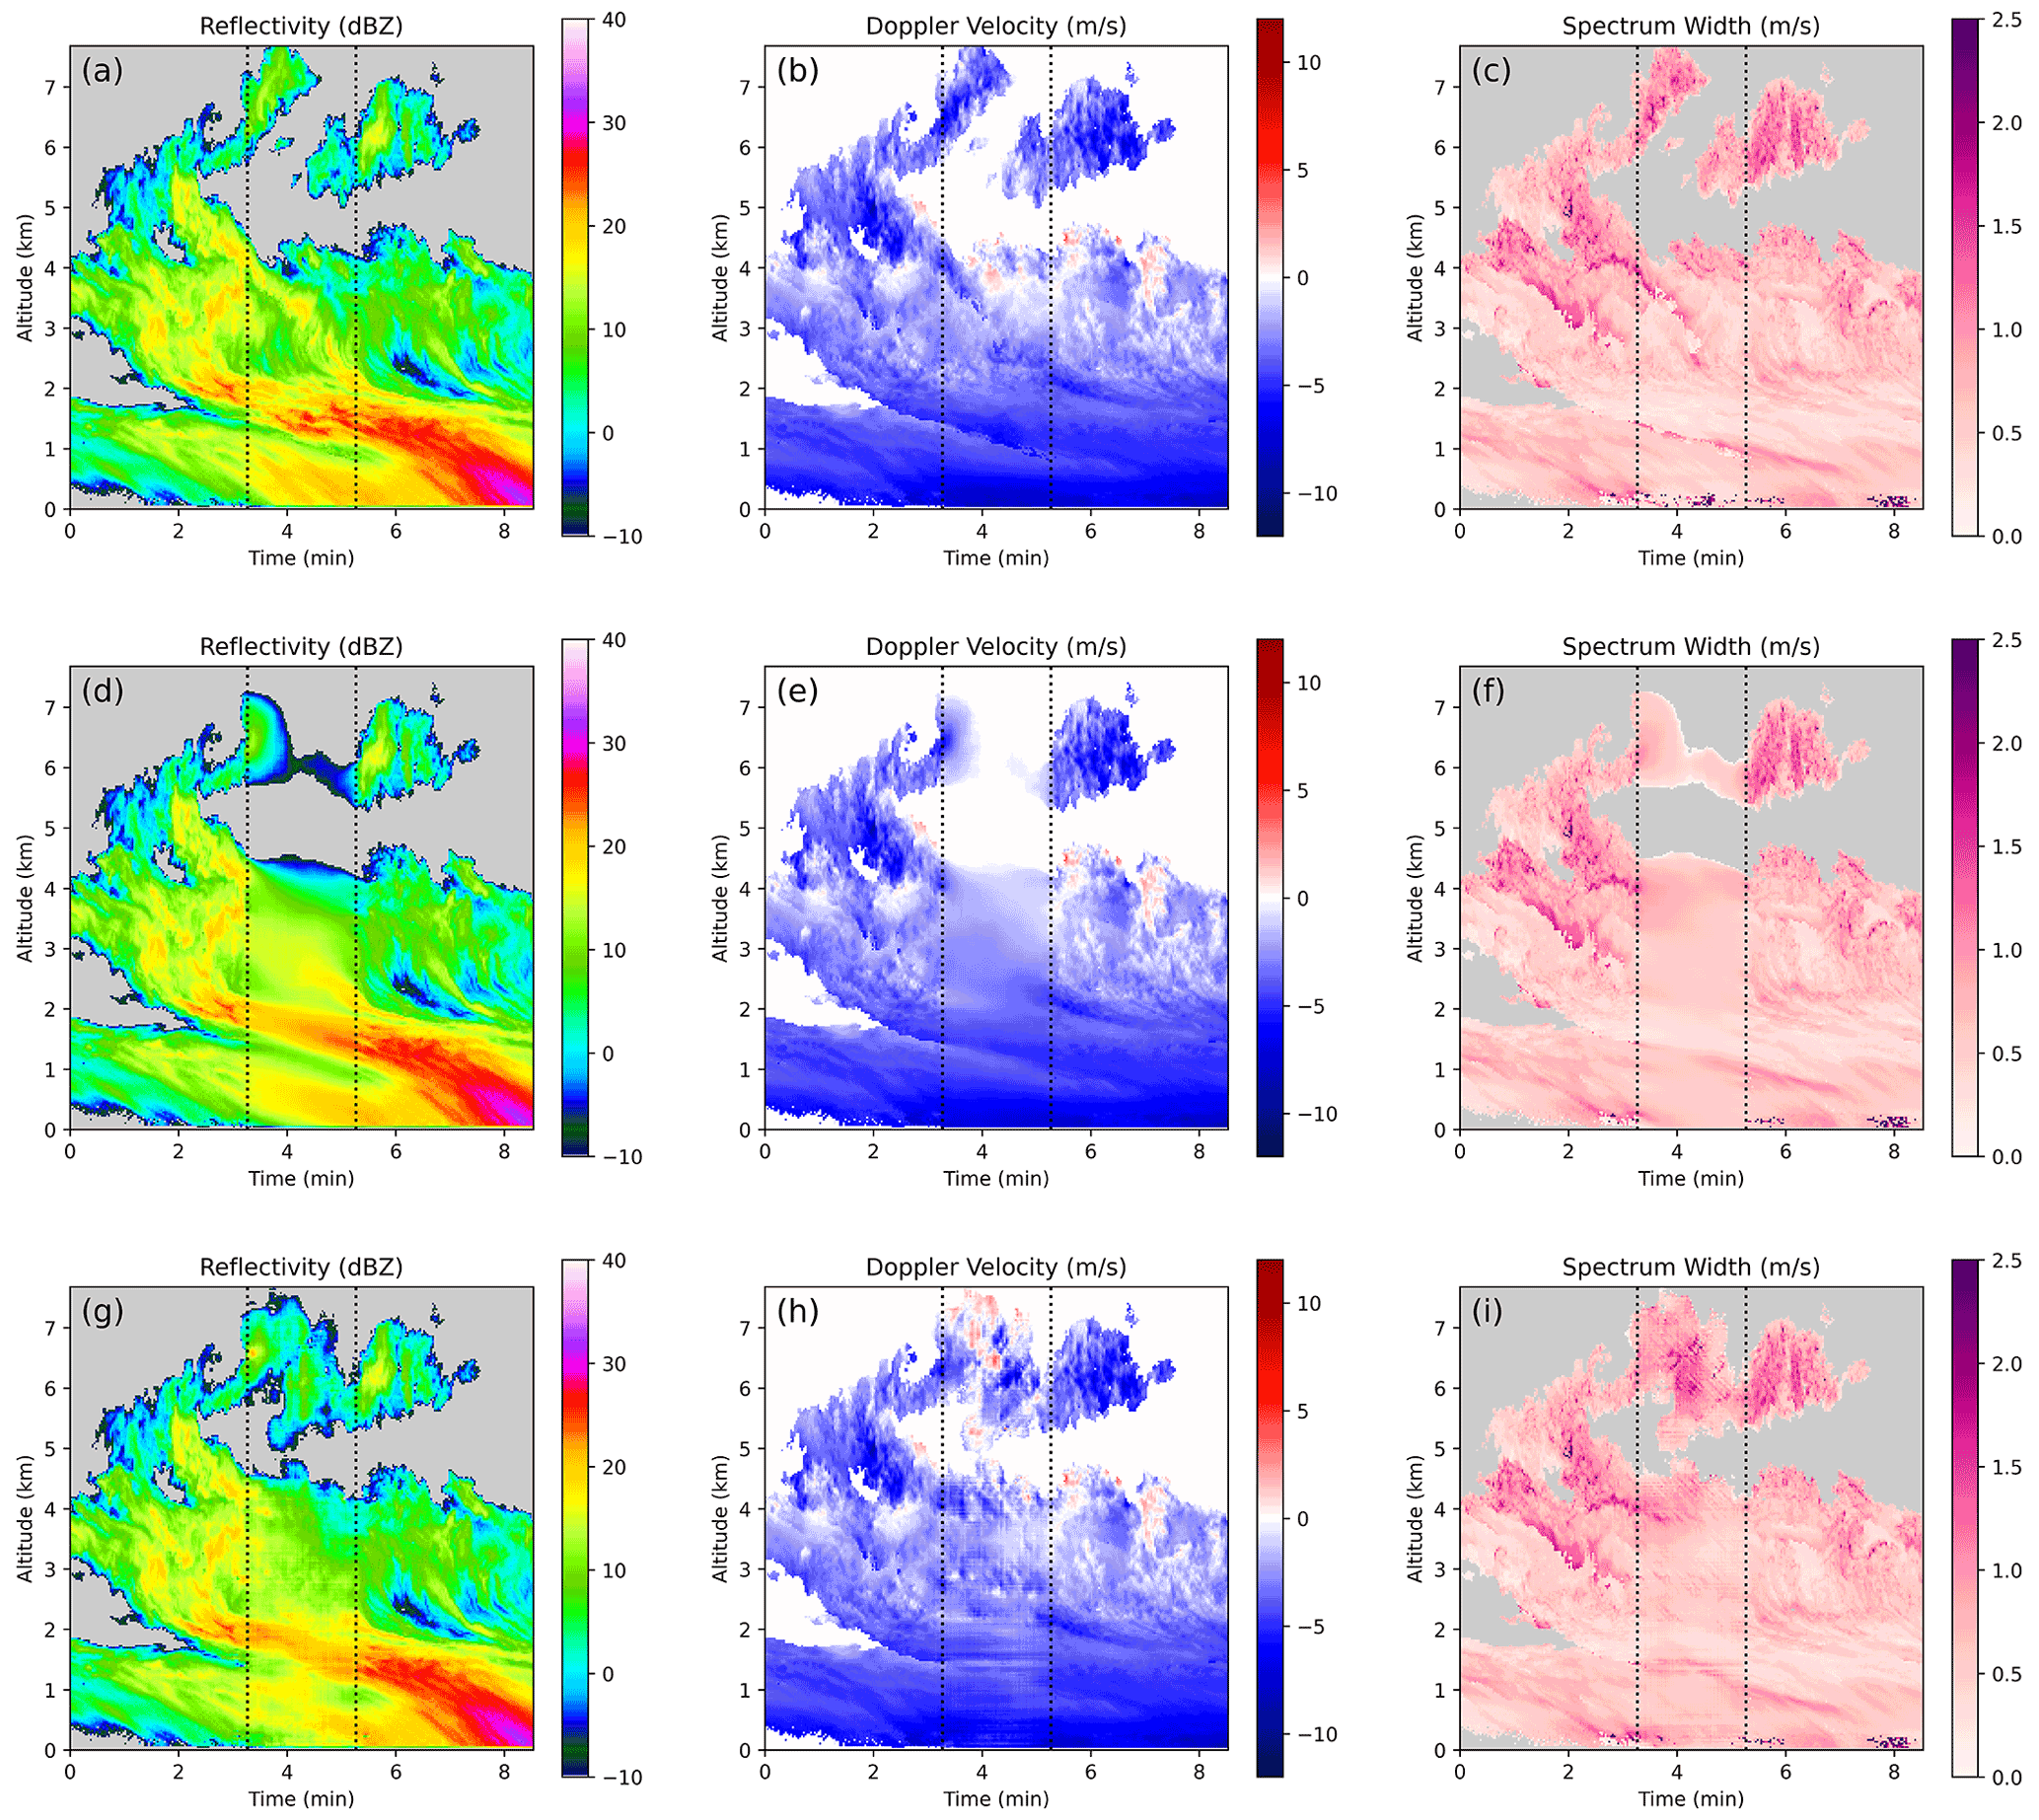
An April 2021 paper tested two deep-learning approaches to fill in regions of radar data images that may be low quality or missing. Such defects can stem from near-ground blind zones, instrument failures, or a radar’s beams getting blocked by trees and other objects.
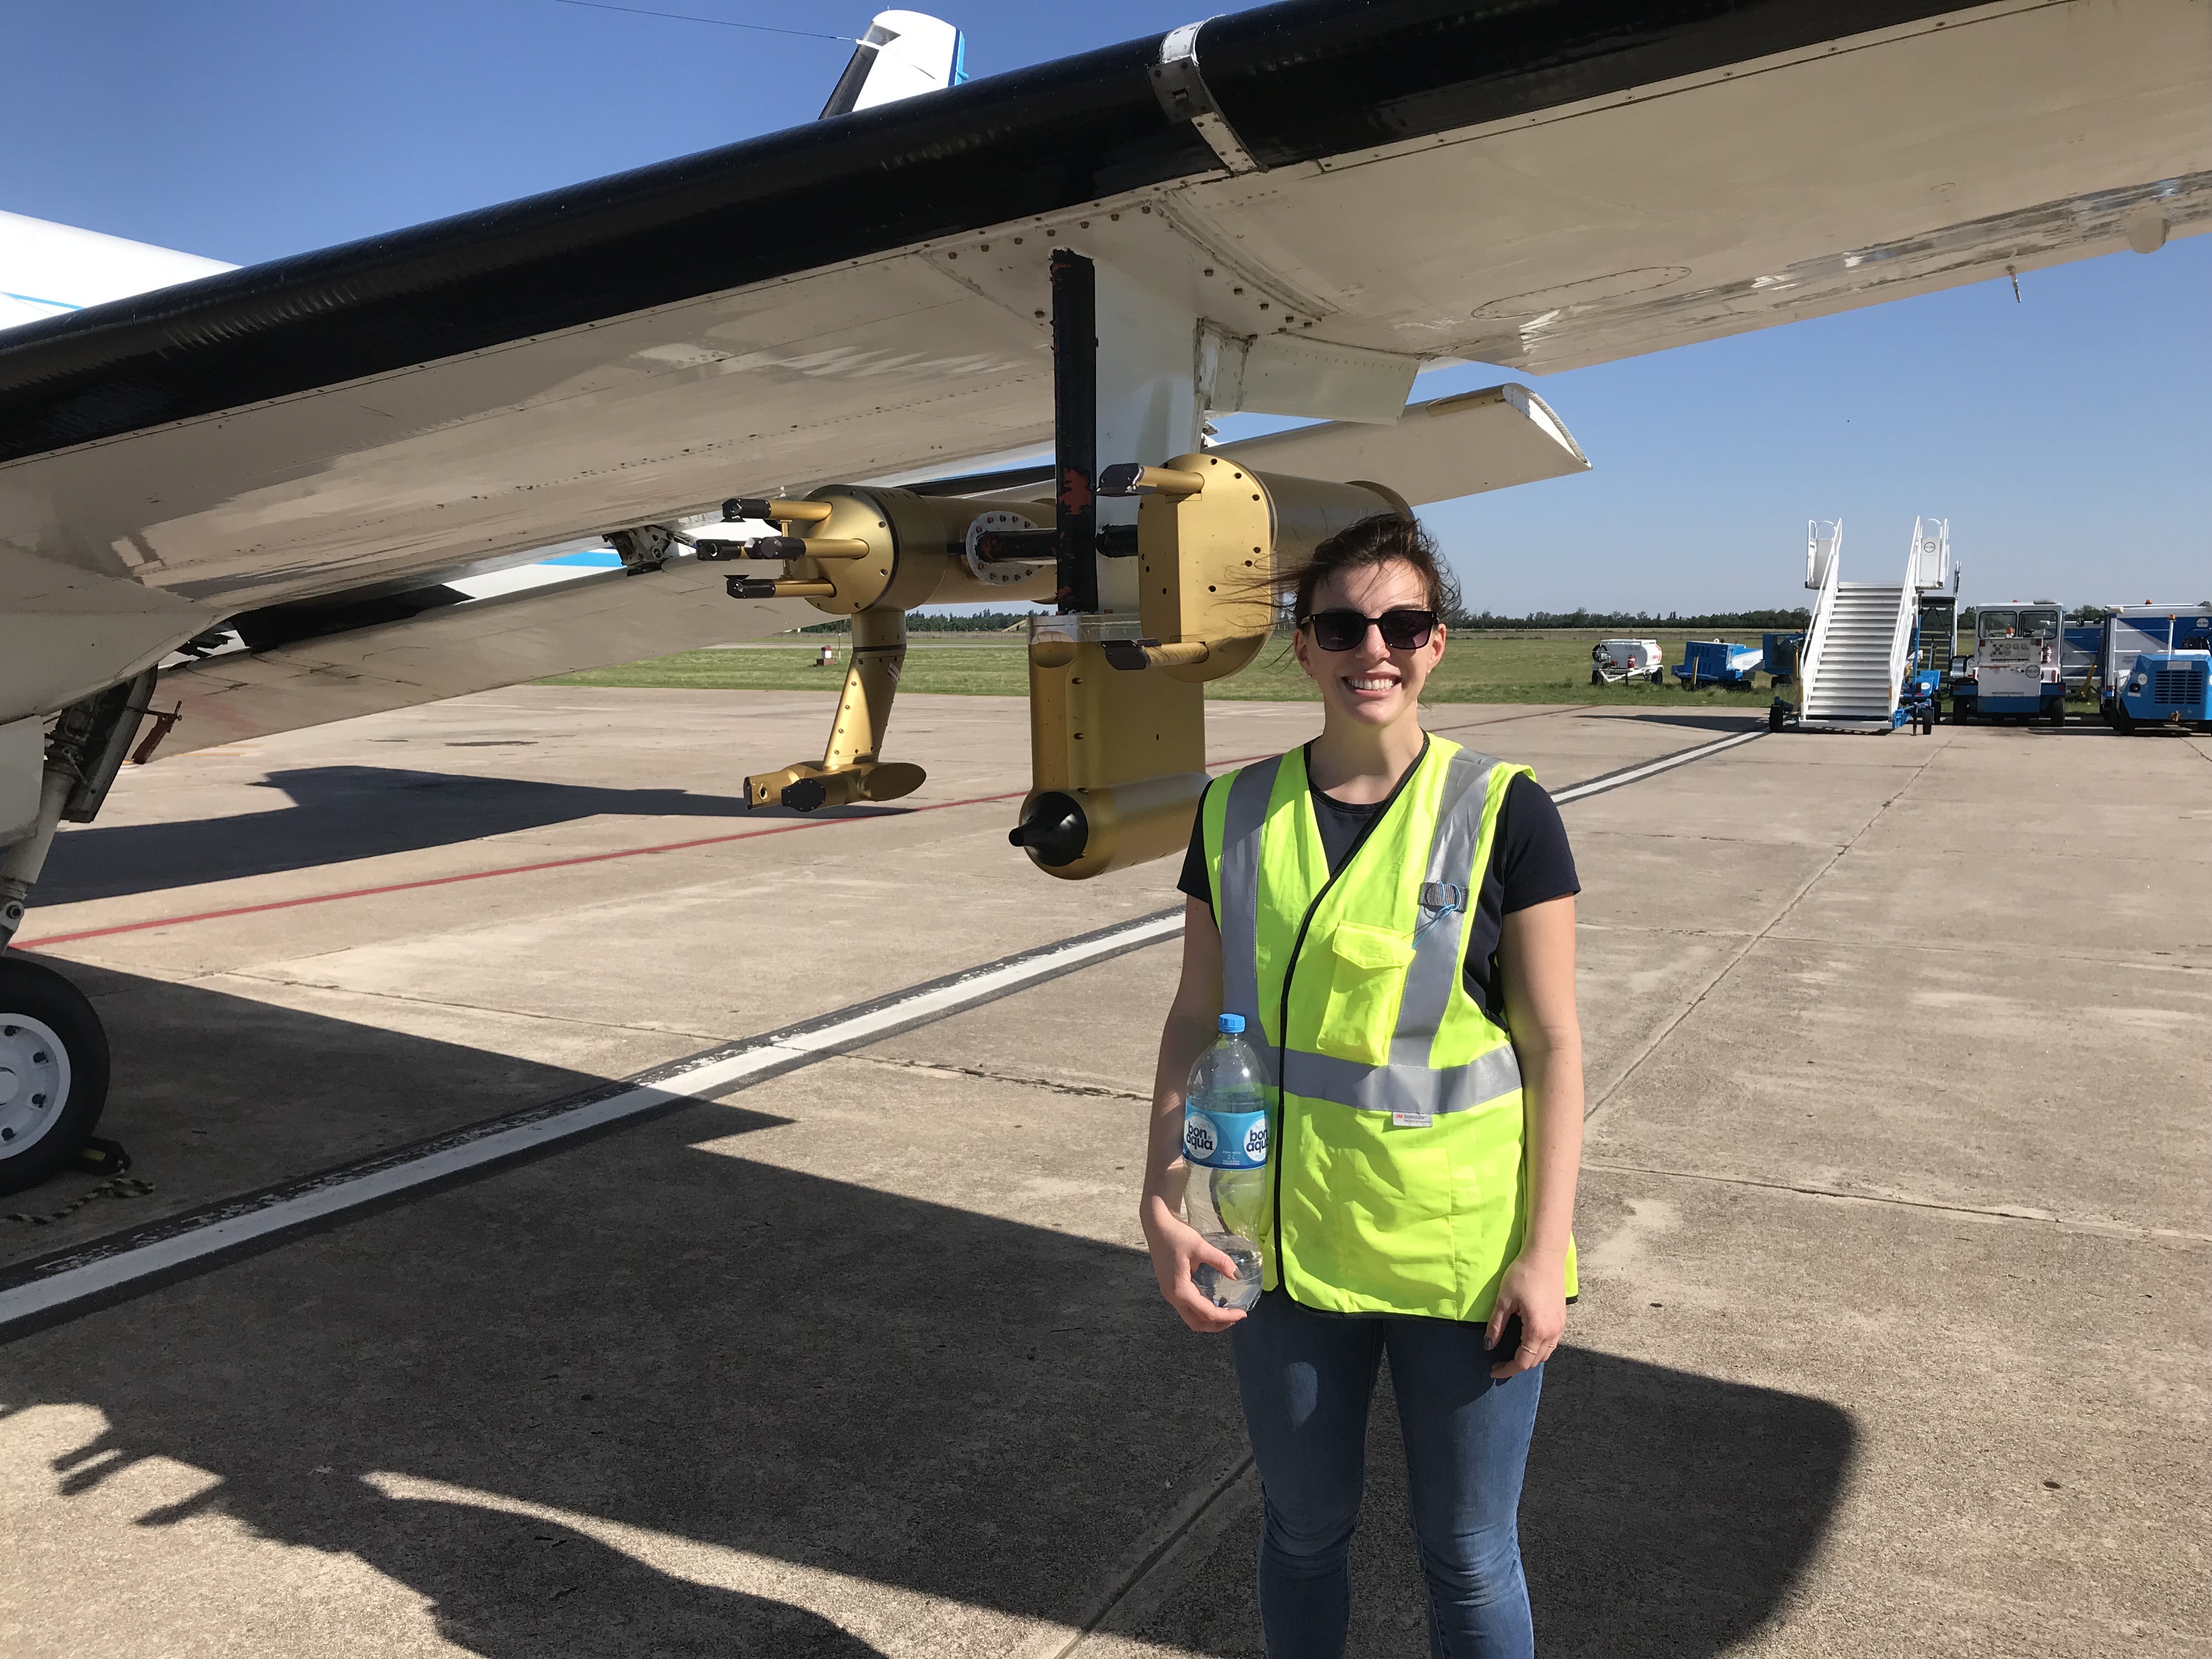
Co-authors Andrew Geiss and Joseph Hardin chose three missing-data scenarios from radars in place during the Cloud, Aerosol, and Complex Terrain Interactions (CACTI) field campaign. The 2018–2019 ARM effort in Argentina investigated the evolution of giant thunderstorms.
Deep-learning approaches in the Geiss-Hardin paper outperformed traditional schemes for filling in radar data regions. Traditional methods often produce unnaturally idealized results. Or they may fail to represent atmospheric turbulence and other small-scale features that are important for weather radars.
A December 2020 paper led by Colorado State University’s Christine Chiu demonstrated a machine-learning technique that addresses discrepancies in how global models represent warm rain in marine boundary-layer cloud decks.
Researchers used data from ARM’s Aerosol and Cloud Experiments in the Eastern North Atlantic (ACE-ENA) field campaign. Chiu’s technique―coded mostly by co-author C. Kevin Yang―captured the complex, nonlinear processes of water droplet coalescence.
The technique allows researchers to “discover the new role of drizzle drops in these processes,” says Chiu, “which has been ignored in the past several decades.”
Beyond her paper, Chiu is eager to impart a message―that “ARM data and artificial intelligence techniques are in a perfect marriage,” she says. “There are all kinds of possibilities to discover new things and, more importantly, to understand detailed processes in science.”
Follow Us:


Keep up with the Atmospheric Observer
Updates on ARM news, events, and opportunities delivered to your inbox
ARM User Profile
ARM welcomes users from all institutions and nations. A free ARM user account is needed to access ARM data.


