

SAIL Science at the High-Water Mark
Published: 20 June 2024
Editor’s note: Daniel Feldman, the principal investigator for the Surface Atmosphere Integrated Field Laboratory (SAIL) campaign in Colorado, sent in this update.

As we approach the summer solstice, the changing of seasons from spring to summer offers a natural time to reflect on the past, consider the present, and plan for the future. This is certainly the case for all of the activities surrounding the SAIL campaign.
June 15, 2024, marked the one-year anniversary of the completion of SAIL’s data collection phase and the start of the campaign’s analysis phase. In the past year, the scientific community has had the opportunity to take the data and make the most out of them.
There are many ways to describe the dimensions of the SAIL campaign and the science it has generated: the atmospheric and surface process research focusing on radiation, aerosol, cloud, precipitation, and boundary-layer processes; the remarkable data record; the collaborations between scientists studying the atmosphere, surface, and subsurface; or even the implications for the many people that rely on the water resources that result from these processes. However, given the hydrometeorology, hydroclimatology, and hydrology foci for SAIL, it’s most useful to describe SAIL-related research in terms of low- and high-water marks, both literally and figuratively.
In terms of a low-water mark, SAIL began its data collection in September 2021 while the Upper Colorado River Basin (UCRB) and the Colorado River, which serves 40 million people and countless ecosystems, were in the throes of a drought the likes of which had not occurred in at least the last millennium. As the instruments were being installed, the UCRB was headed to a literal low-water mark, and what was initially merely concerning started to become more and more alarming as the Western United States began to make contingency plans for what would happen should water levels go even lower. It also highlighted the central role of science investigations for those plans, as the low-water mark occurred in the face of only slightly-below-average precipitation and led to a lot of head-scratching. The atmosphere and surface interaction processes across the UCRB were having very acute impacts on society and ecosystems, and tackling the uncertainty in those processes was not just an academic undertaking, but one in which science and practice were (and are) very closely connected.
Since the start of SAIL, though, the Western United States and the UCRB have bounced back. Average and well-above-average precipitation in water years 2022 and 2023 slaked the thirst of the West, eliminating much of its surface drought and pushing water levels higher in reservoirs across the region. At the end of the day, SAIL took place in the midst of the myriad processes that contributed to this recovery.
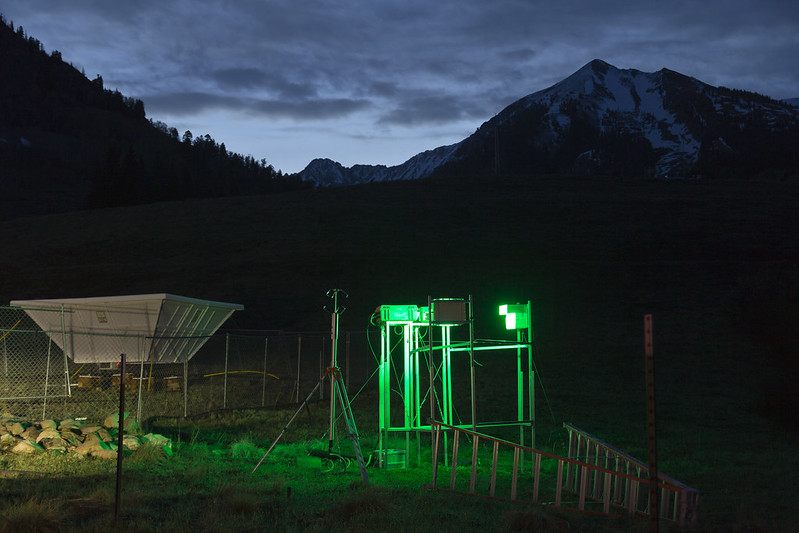
In terms of high-water marks, the most scientifically exciting one is figurative. This high-water mark arises from the data density that the SAIL campaign achieved with its deployment of dozens of instruments as part of the second ARM Mobile Facility (AMF2) package and ARM tethered balloon system flights, as well as its partnerships with DOE’s Watershed Function Scientific Focus Area (SFA), NOAA’s Study of Precipitation, the Lower Atmosphere and Surface for Hydrometeorology (SPLASH), the National Science Foundation’s Sublimation of Snow (SOS) campaign, and the Rocky Mountain Biological Laboratory (RMBL). This atmosphere-through-bedrock observatory at the East River Watershed created easily the most heavily instrumented mountainous watershed in North America, with data freely available from the following:
Beyond the major presence of the East River Watershed in the mountain hydrometeorology and hydroclimatology communities, notable scientific findings are already arising from this high-water mark.
For example, X-band scanning radar data from SAIL and SPLASH were collected with a coordinated scanning strategy and, along with thermodynamic profiles (from SAIL’s twice-daily weather balloon launches) and surface meteorology data, have supported detailed analyses of major snowstorms in the region, showing exactly how they deliver epic levels of snowfall. More recently, research has found that these storms are common phenomena during the La Niña conditions in which SAIL collected data and are significant contributors to annual water budgets.
Meanwhile, SAIL data (specifically, tropospheric profiles of thermodynamics and wind from weather balloons, retrievals of cloud liquid water path from the dual-channel microwave radiometer, and profiles of aerosol and cloud particulate backscatter and depolarization ratio from the high-spectral-resolution lidar) supported findings that low-level, liquid-bearing clouds are strong drivers of change in the wintertime surface energy balance.
Still another example used optimal-estimation retrievals from atmospheric emitted radiance interferometer data, which detail the evolution of atmospheric boundary-layer thermodynamic state, to show the snowpack’s major influence on atmospheric boundary-layer dynamics.
Do you want to start your SAIL data journey? Browse SAIL data in the ARM Data Center. (To download data, first create an ARM account.)
Other exciting research has found that snowpack observations, including snow surveys from the Airborne Snow Observatory, can serve as a non-traditional observational constraint on cloud microphysical process representations in atmospheric process models. In a paper published this spring, SAIL data (specifically, measurements of surface air and skin temperature, surface winds, humidity, longwave radiation, and cloud vertical structure) showed that the widespread surface temperature cold biases exhibited in process and earth system models in mountains worldwide are not the result of a single model error, but rather arise from a whole suite of issues that need to—and can be—addressed systematically.
Surveying the SAIL science one year after the end of the campaign, it is clear that the excitement of scientific discovery continues and is being led by a dedicated and growing community of researchers.
Want to join the SAIL community? Email Sara Hefty.
Follow Us:


Keep up with the Atmospheric Observer
Updates on ARM news, events, and opportunities delivered to your inbox
ARM User Profile
ARM welcomes users from all institutions and nations. A free ARM user account is needed to access ARM data.


