

Effective visualization of radar data for users impacted by color vision deficiency
Submitter
Sherman, Zachary Scot
— Argonne National Laboratory
Grover, Maxwell — Argonne National Laboratory
Area of Research
Cloud Processes
Journal Reference
Sherman Z, M Grover, R Jackson, S Collis, J O’Brien, C Homeyer, R Chase, TJ Lang, D Stechman, A Sockol, K Muehlbauer, J Thielen, A Theisen, S Gardner, and DB Michelson. 2024. "Effective Visualization of Radar Data for Users Impacted by Color Vision Deficiency." Bulletin of the American Meteorological Society, 105, 10.1175/BAMS-D-23-0056.1.
Science
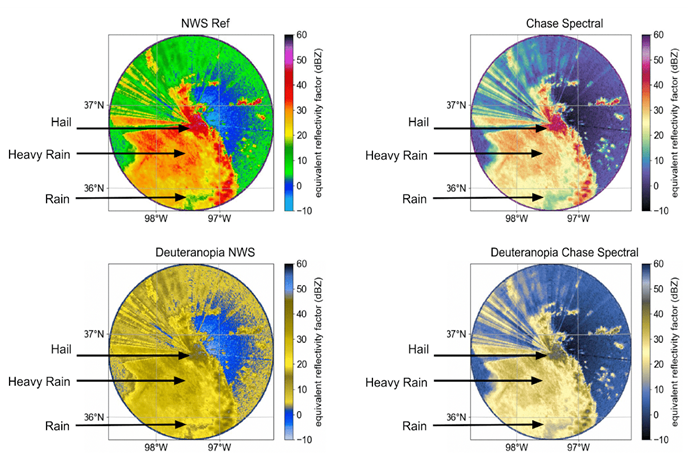
Viewing a storm system using the NWS Reflectivity colormap and the Chase Spectral CVD friendly colormap. The first row shows what an individual without CVD sees and the bottom row shows what an individual with CVD sees. Image courtesy of Zachary Sherman, Argonne National Laboratory.
Color Vision Deficiency (CVD) is a decreased ability to discern between particular colors, such as red and green. Many individuals in the sciences have CVD and can have issues with reading data depending on the colormap that is used. This is especially true in the weather radar community as many colormaps do not highlight features well for those with CVD. Researchers created CVD friendly colormaps and some existing colormaps were tested on different weather events using software that visualized the data through the eyes of an individual with CVD. These new colormaps are also as close to perceptual uniformity as possible and have meaningful colors and color breaks to avoid creating artificial structure in the visualization of the data.
Impact
Providing these CVD friendly colormaps allows for equitable scientific visualization and inclusivity. Those with CVD can read these visualizations and be included. Users are able to pick out features in different storms using the new colormaps. The colormaps reduces artificial structure by having mostly linear lightness values for each color. They have been uploaded to a Python package, cmweather, and are open to anyone to use. These colormaps also create a broader discussion for more CVD friendly colormaps while working with the community to do so.
Summary
Eight percent of genetic males and half a percent of genetic females have some form of CVD, with many in the radar community falling into this group. When presenting data on a two-dimensional plane, it is common to use colors to represent values via a colormap. Colormap choice in the radar community is influenced by the ability to highlight scientifically interesting features in data, institutional choices, and domain dominance of legacy colormaps. The problem with these current colormaps is that many do not project well for those with CVD (i.e., green next to red).
Multiple colormaps for equivalent reflectivity factor and Doppler velocity were tested for users with various forms of CVD. This was possible by working with those in the CVD community as well as using Python tools that allow visualization of images through a CVD lens. Researchers showed how these colormaps can improve interpretability for four cases: a mesoscale convective system, a pyrocumulonimbus storm, a wintertime mid-latitude cyclone, and widespread storms with a large bird migration. The new CVD colormaps can highlight rain, frozen precipitation, non-meteorological targets, and velocity-based items, as well as being perceptually uniform and accessible for those with CVD. The new radar equivalent reflectivity factor, Doppler velocity, and polarization colormaps are inclusive and accessible to those with CVD.
Follow Us:


Keep up with the Atmospheric Observer
Updates on ARM news, events, and opportunities delivered to your inbox
ARM User Profile
ARM welcomes users from all institutions and nations. A free ARM user account is needed to access ARM data.


