

Locally narrow droplet size distributions are ubiquitous in stratocumulus clouds
Submitter
Shaw, Raymond A
— Michigan Technological University
Area of Research
Cloud Processes
Journal Reference
Allwayin N, M Larsen, S Glienke, and R Shaw. 2024. "Locally narrow droplet size distributions are ubiquitous in stratocumulus clouds." Science, 384(6695), 10.1126/science.adi5550.
Science
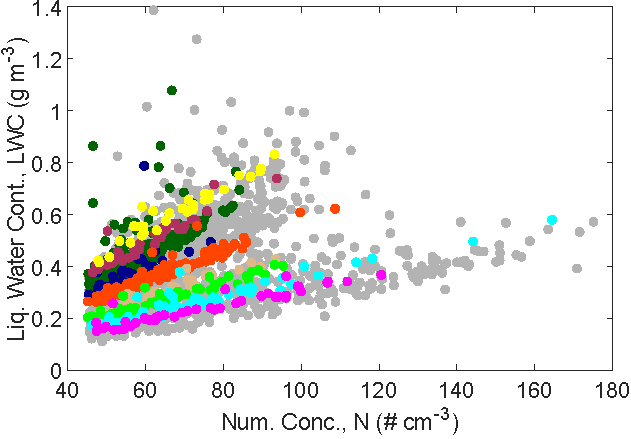
Figure 1. Cloud liquid water content versus cloud droplet concentration, suggesting that microphysical relationships for individual clusters of similar holograms can reflect cloud histories. Cloud liquid water content and number concentrations for different clusters, denoted by the colors, have a linear relationship, with slope depending on the cluster type. As the distribution shape and, correspondingly, the mean diameter remain constant for holograms of a cluster, the linear reduction in LWC with number concentration suggests a predominance of dilution and, complete evaporation of droplets during the mixing process with dry environmental air (inhomogeneous mixing). Image from journal.
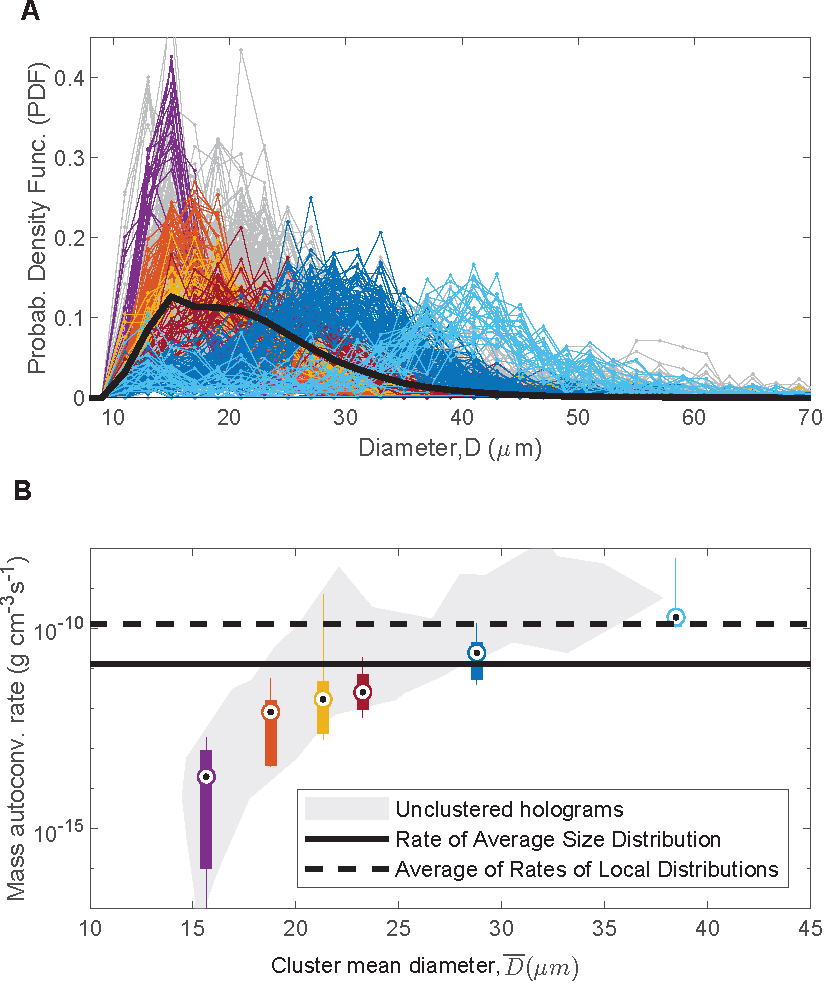
Figure 2. Collisional growth rates for characteristic droplet size distributions. The mass autoconversion rate is a measure of initial cloud droplet growth by collision-coalescence until efficient development of precipitation by accretion. (A) The different colors correspond to the characteristic distributions, and the gray marks the unclustered holograms. The solid black line represents the global distribution for the entire segment. (B) Mass autoconversion rates for the different characteristic distributions versus the mean diameter of the local distributions. The box plots display the median (central dot), the 25th and 75th percentiles (box), and the 5th and 95th percentiles (lines) of the local autoconversion rates for the holograms in each cluster, with the color scheme the same as in (A). Most of the individual process rates differ substantially from the value calculated with the average size distribution, which is represented by the solid black line. That global average rate also differs by an order of magnitude from the average of the local autoconversion rates, which is shown by the dashed black line. The gray region marks the range of autoconversion rates for the unclustered holograms. The data are from a 40-km flight segment in a stratocumulus cloud on 19 July 2017 at an altitude of 1350 m. Image from journal.
Cloud process rates such as drizzle formation depend on the assumed cloud droplet size distribution shape. These droplet size distributions are based on spatially averaged measurements of cloud droplet number concentration and diameter and are often represented in models as broad gamma distributions.
Impact
Regions of stratocumulus cloud contain cloud droplets with similar sizes, that when averaged together result in a broad droplet size distribution. Local droplet concentrations are diluted to varying degrees, but the distribution shapes tend to persist within these regions. Cloud process rates such as the formation of drizzle are influenced by this nonuniform distribution of droplet size distribution shapes.
Summary
The Holographic Detector for Clouds (HOLODEC) captured 10-cubic-cm-sized samples of droplets in stratocumulus clouds during the ACE-ENA field project based at the ARM Eastern North Atlantic Observatory in the Azores archipelago. The droplet size distributions at these "local" scales are narrow, and only when averaged over 10s of km do the usual broad gamma distributions appear. Like-shaped distributions tend to reside together, and are diluted to varying extents. This suggests that the limit of inhomogeneous mixing is a good approximation in these clouds. The organization in regions, with inhomogeneous mixing acting within those regions, provides a simplified basis for representing variability in cloud droplet size distributions. Cloud process rates depend on this variability, for example, a globally averaged mass autoconversion rate is not equal to the mean of local autoconversion rates. Thus, the variability in droplet size distribution shape, as well as number concentration and liquid water content, should be considered.
Follow Us:


Keep up with the Atmospheric Observer
Updates on ARM news, events, and opportunities delivered to your inbox
ARM User Profile
ARM welcomes users from all institutions and nations. A free ARM user account is needed to access ARM data.


