

A Years-Long Storm of Good Papers
Published: 20 August 2018
A 2011 field campaign on convective clouds has so far yielded 57 papers and some transformative science
MC3E, or the Midlatitude Continental Convective Clouds Experiment, has a name almost as big as the Midwestern sky it investigated more than seven years ago.
Then again, there was a lot to do. Improve what we know about the physical processes and life cycles of convective clouds, for one. These huge assemblies of water, heat, and momentum play a critical role in earth system processes.
And there has been a lot of research generated from the experiment since it unfolded between April 22 and June 6, 2011. So far, 57 papers have been published using MC3E data, according to campaign lead scientist Michael Jensen, a meteorologist at Brookhaven National Laboratory (BNL) in New York.
The U.S. Department of Energy’s Atmospheric Radiation Measurement (ARM) user facility processed and archived the data.
MC3E was a joint experiment between ARM and NASA’s Global Precipitation Measurement (GPM) Ground Validation Program. Jensen called MC3E “one of the most successful campaigns ARM has ever done.”
Seconding that sentiment was Walt Petersen, the GPM lead scientist from the NASA Marshall Space Flight Center.
“MC3E was a joint, multiagency campaign in every sense of the word,” he says. “That is one of the successes to be touted as well.”
MC3E provided “important cloud and precipitation data sets,” Petersen adds, which were “used to model and confirm satellite-based remote methods for estimating precipitation from the vantage point of space.”
It’s a good thing MC3E was such a success. Convective clouds have a critical place in the large-scale atmospheric processes that sustain life. They hold water in the atmospheric column. Their effect on surface heat contributes to local-scale energy balance and affects the formation of further clouds.
Convective clouds influence ecosystems and water resources through the precipitation they produce. And they are at the center of processes that create severe weather events and flooding.
It is no wonder that scientists have a deep interest in using their ground- and satellite-based remote sensing tools to monitor and observe convective systems.
At the same time, convective cloud physics is one of the most challenging issues in both weather forecasting and earth system modeling.
“And in the end, that’s what we’re trying to do,” said Jensen of campaigns like MC3E and the insights and data they create. “Impact climate models.”
Three Vantage Points
MC3E took place at ARM’s Southern Great Plains (SGP) atmospheric observatory, which spans thousands of square miles in Oklahoma and Kansas. This midlatitude continental region is famous for its dramatic convective storms during spring and summer.
The MC3E objectives were to collect observations that advance the understanding of convective simulations in models, along with the microphysical parameterizations that inform them.
The campaign was also intended to collect data sets that improve satellite estimates of rainfall in deep convective systems over land.
A large repository of the MC3E data is archived in the Earth Observing System Data and Information System Distributed Active Archive Centers linked to NASA’s Global Hydrology Resource Center, and according to Petersen, “pointers exist between the NASA and DOE archive sites.”
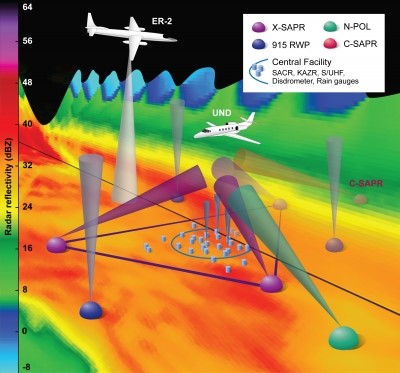
To collect the right data in the right way, Jensen and a team of other ARM and NASA scientists mapped out a three-part operational field strategy.
First part was aircraft platforms and instrumentation. NASA’s ER-2 aircraft flew transects (pre-patterned flights) covering a sampling domain at an altitude of around 20 kilometers (12.4 miles). It carried downward-pointing radars, radiometers, and other gear that turned the aircraft into the equivalent of a GPM satellite simulator.
At altitudes between 4 and 13 kilometers (2.5 and 8 miles), the University of North Dakota’s Cessna Citation jet aircraft hefted a suite of meteorological instruments into the air, along with probes that investigated in-cloud microphysical properties.
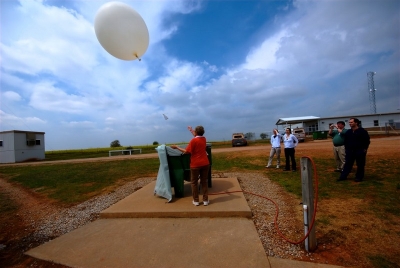
Second, a six-site radiosonde network covered a 90,000-square-kilometer (56,000-square-mile) span of sky. (A “radiosonde” is a sonde—balloon-borne sounding system—fitted with instruments and a transmitter.)
Researchers launched helium-filled weather balloons four times a day in non-convective conditions to sample the diurnal cycle. Instruments aboard recorded temperature, humidity, and wind properties.
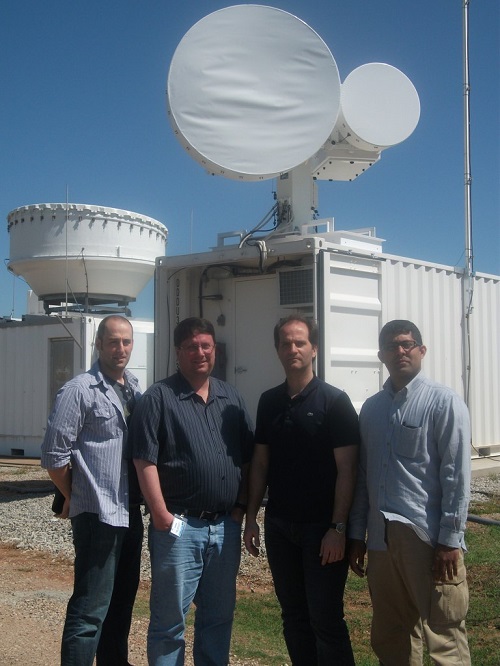
Third, a multifrequency array of ground-based radars (all nested inside the radiosonde network) covered an area of 60 kilometers around the SGP’s heavily instrumented Central Facility.
Within a 6-kilometer area of the Central Facility were rain gauges, 2D video disdrometers (instruments measuring the drop-size distribution and velocity of various forms of precipitation), and other instruments.
Many deep-convection events were captured during MC3E, including three that were “golden”—that is, particularly useful.
One such event, on May 20, 2011, included an extended stratiform shield (low-level clouds with a horizontal base) and trailing rains. Coordinated flights made important data captures.
In part, this event opened the way to a NASA-led paper that appeared in 2016 and was led by William Olson of the Joint Center for Earth Systems Technology at the University of Maryland, Baltimore County.
The study’s objective was to evaluate spherical and nonspherical snow particle scattering models by using an airborne radar and other gear available during MC3E. Data from these instruments were used to test the consistency of different snow particle models and to evaluate estimated snow-particle size distributions from airborne remote-sensing instruments.
On May 23, 2011, another “golden” data opportunity occurred: a supercell event that piled up fast-growing anvil clouds. Coordinated ground- and air-based instrumentation captured the kind of data that made rich microphysical analysis possible.
Collectively, MC3E gave scientists data on an important variety of representative conditions: convective line (cell) events, widespread stratiform rain, weak overnight convection, boundary layer clouds, mid- and upper-level clouds, and clear-sky intervals.
In all, the ARM-NASA campaign characterized the 4D properties of convective clouds and precipitation.
MC3E data will live on for many years, participating scientists say. They are still improving how the life cycles of convective clouds are represented in models, as well as the reliability of satellite-based retrievals.
Updrafts, Radars, and Ice
Each of MC3E’s 57 papers deserve a deep-diving look, but Jensen says three in particular represent the utility of the campaign.
One of the earliest papers used data from the wind profilers deployed during MC3E to characterize vertical velocity in convective updrafts.
“This has been notoriously difficult to do,” says Jensen, “and is important for representing updrafts in models.”
Led by BNL’s Scott Giangrande, the study summarized convective core vertical velocity properties observed during the 2011 field exercise. In part, the authors drew on hard-to-get direct measurements within active severe storms.
Data showed intense updraft cores moving as fast as 20 meters (65.6 feet) per second, and that these cores were weakly correlated with updraft diameter length.
Jensen also pointed to a 2016 paper on co-located polarimetric radar and lightning data collected during MC3E.
Polarimetric radars supply data on both the horizontal and vertical dimensions of cloud particles and represent a different way to constrain the convective core in models.
Lead author Marcus van Lier-Walqui, of Columbia University and NASA’s Goddard Institute for Space Studies (GISS), and his co-authors demonstrated that such radars can be used to both locate and see inside updrafts.
Says Jensen of this polarimetric radar collaboration: “They were one of the first groups to do a lot with that.”
A third paper, from 2017, documented an improved convective ice parameterization for the NASA GISS Global Climate Model: a better way to represent the character of ice inside convective storms, which presents a challenge for earth system models in general.
Led by Gregory Elsaesser, also of Columbia University and NASA GISS, the study outlines an ice parameterization that takes into account new MC3E-derived ice particle fall speeds and new convective outflow particle size distributions.
“It’s a really nice example of how our (campaign) data and ARM data were used, in general, to develop a new parameterization,” says Jensen.
NASA-led papers on multifrequency radiometer and radar radiative transfer modeling confirmed basic aspects of several things: ice microphysical effects on precipitation retrieval algorithm approaches, effects of multiple scattering for space-borne multifrequency radar observations, and precipitation drop-size distribution variability in rain.
Beyond specific papers, MC3E points to ongoing and future research. Of particular interest is the emerging power of polarimetric radars, especially once they begin scanning 100-kilometer (62-mile) spans of sky faster and with higher resolution.
Says Jensen: “That’s where the frontiers are of the next science we want to do.”
The ARM Climate Research Facility is a DOE Office of Science user facility. The ARM Facility is operated by nine DOE national laboratories.
Follow Us:


Keep up with the Atmospheric Observer
Updates on ARM news, events, and opportunities delivered to your inbox
ARM User Profile
ARM welcomes users from all institutions and nations. A free ARM user account is needed to access ARM data.


