

Characterized and Calibrated Radar Data Now Available for TRACER Campaign
Published: 26 July 2024
Scientists interested in researching convection can now use characterized and corrected radar data from the 2021–2022 TRacking Aerosol Convection interactions ExpeRiment (TRACER) in the Houston, Texas, area. These data are considered b1-level, meaning they underwent calibration, correction, and quality control processes beyond the Atmospheric Radiation Measurement (ARM) user facility’s standard quality checks and corrections.
ARM produced b1-level data for the following radars that operated as part of TRACER:
- the second-generation C-Band Scanning ARM Precipitation Radar (CSAPR2)
- X-Band Scanning ARM Cloud Radar (XSACR)
- Ka-Band Scanning ARM Cloud Radar (KASACR)
- Ka-Band ARM Zenith Radar (KAZR).
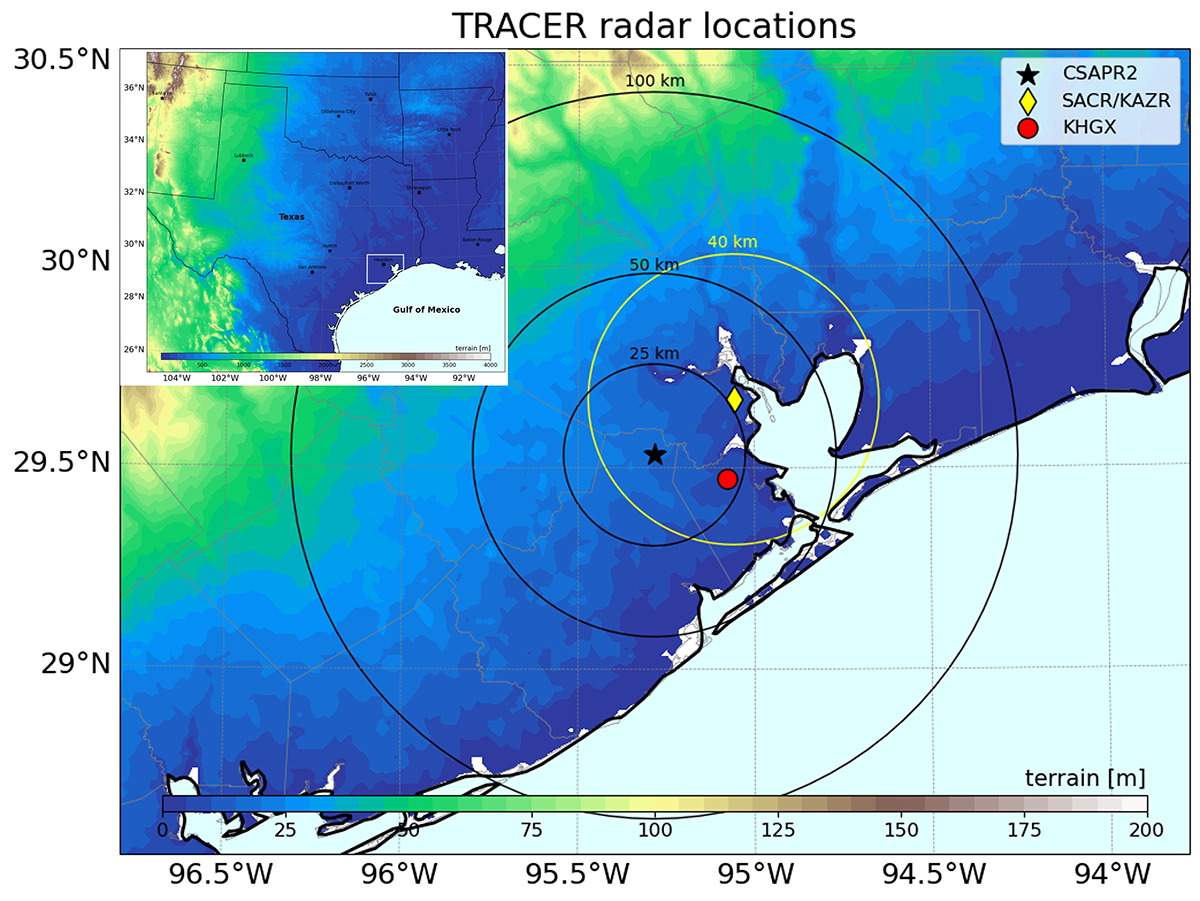
TRACER provided a unique opportunity to study convection in clean and polluted air using data from multiple radars. The XSACR, KASACR, and KAZR operated as part of the ARM Mobile Facility at TRACER’s main instrument site in La Porte, Texas, while the CSAPR2 was about 30 miles away in Pearland, Texas.
During TRACER’s intensive operational period from June 1 to September 30, 2022, the CSAPR2 tracked the life cycle of chosen storm cells through automated tracking methods.
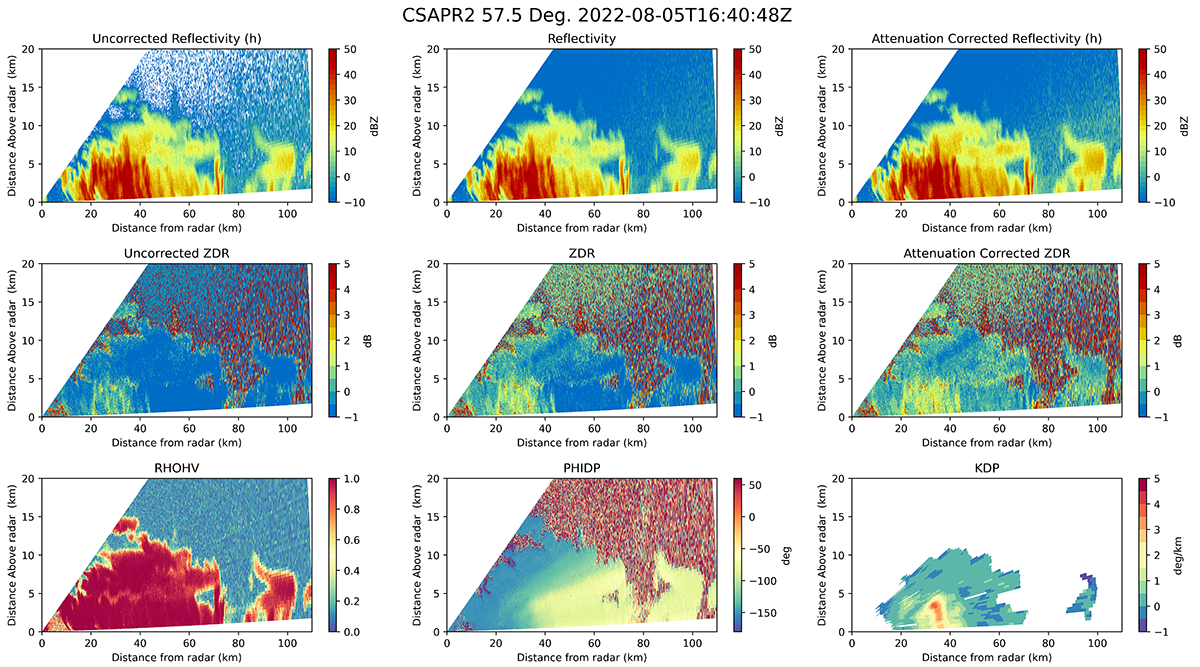
ARM staff applied reflectivity offsets (listed on page 6 [Table 4] of the TRACER b1-level radar data processing technical report) and meteorological echo masks to each radar data set. The meteorological echo masks allow scientists to quickly remove background noise and clutter when needed.
In addition, the CSAPR2 and XSACR data include differential reflectivity bias correction and derived specific differential phase calculations.
The XSACR, KASACR, and KAZR b1-level data cover the bulk of the TRACER campaign, which ran from October 1, 2021, through September 30, 2022. The CSAPR2 b1-level data are from April 20 through September 30, 2022, when the radar operated reliably for scientific use following changes and repairs by ARM’s radar engineering team.
The corrected and characterized data sets are all available now in CfRadial format.
More information about the data can be found in the TRACER b1-level radar data processing technical report.
For questions or to report data problems, please contact the ARM radar team.
Access the CSAPR2, XSACR, KASACR, and KAZR b1-level data in the ARM Data Center. (To download the data, first create an ARM account.)
To cite the data, please use the following DOIs:
- CSAPR2: doi:10.5439/2001313
- XSACR: doi:10.5439/2001296
- KASACR: doi:10.5439/1877338
- KAZR: doi:10.5439/1615726 (general sensitivity mode) and 10.5439/1615486 (moderate sensitivity mode).
Follow Us:


Keep up with the Atmospheric Observer
Updates on ARM news, events, and opportunities delivered to your inbox
ARM User Profile
ARM welcomes users from all institutions and nations. A free ARM user account is needed to access ARM data.


