

Large-Scale Forcing Data Released for SAIL Campaign
Published: 18 June 2024
Continuous large-scale forcing data are now available for the Surface Atmosphere Integrated Field Laboratory (SAIL) field campaign. The Atmospheric Radiation Measurement (ARM) user facility conducted the SAIL campaign in high-altitude complex terrain near Crested Butte, Colorado, from September 2021 to mid-June 2023.
Scientists can use this value-added product (VAP), known as VARANAL, to drive single-column models, cloud-resolving models, and large-eddy simulation models for different cloud and convective systems. To help validate model simulations, the VAP includes diagnostic fields such as diabatic heating profiles, cloud fields, surface measurements, and large-scale conditions.
Forcing data for SAIL were developed from a constrained variational analysis approach documented in Zhang and Lin (1997) and Zhang et al. (2001). Different from the standard VARANAL data product, which is derived using a pressure coordinate algorithm and assumes a flat surface, a terrain-following sigma coordinate algorithm was applied in developing VARANAL for SAIL. This algorithm was designed to better treat the slope of terrain in the analysis so that the effect of the surface terrain on the derived large-scale forcing fields can be captured and represented (Tang et al. 2020). After performing the constrained variational analysis in sigma coordinate, the large-scale forcing fields are converted back into pressure coordinate to keep consistent with other VARANAL data products.
This version of VARANAL for SAIL was developed based on European Centre for Medium-Range Weather Forecasts (ECMWF) Reanalysis version 5 (ERA5) data, which are available for whole months. Based on feedback from SAIL’s science team, VARANAL evaluation data were produced for the following nine months:
- September and December 2021
- April, May, and July 2022
- January, April, May, and June 2023.
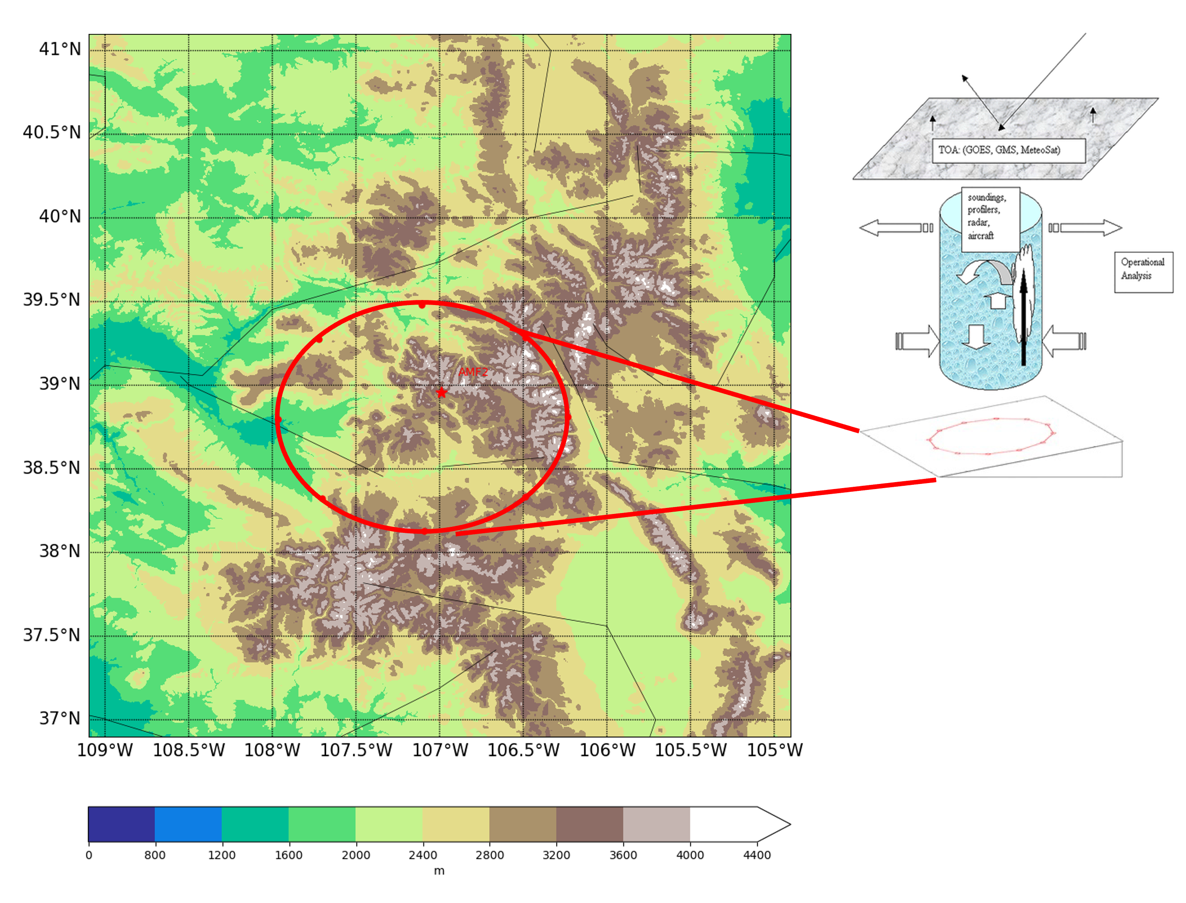
The forcing data represent an average over the analysis domain, centered at 107.1oW, 38.805oN with a radius of 75 kilometers.
The data are in netCDF format, with a time resolution of 60 minutes and a vertical resolution of 25 hPa.
Scientists can begin using the SAIL large-scale variational analysis forcing data for model simulation and evaluation. Please note: Because the VARANAL data represent averages over the analysis domain, users need to be cautious when comparing them with ARM single-point measurements.
More information about VARANAL can be found on the VAP web page. Additional details about ARM continuous forcing data are in Xie et al. (2004).
To ask questions, report data issues, or provide feedback on the new SAIL VARANAL evaluation data, please contact ARM VAP developer Cheng Tao or ARM translator Shaocheng Xie.
Access the data in the ARM Data Center. (To download the data, first create an ARM account.)
To cite the data, please use doi:10.5439/1961987.
References:
Zhang M and J Lin. 1997. “Constrained Variational Analysis of Sounding Data Based on Column-Integrated Budgets of Mass, Heat, Moisture, and Momentum: Approach and Application to ARM Measurements.” Journal of the Atmospheric Sciences, 54(11), 1503-1524, doi:10.1175/1520-0469(1997)054<1503:CVAOSD>2.0.CO;2.
Zhang M, J Lin, RT Cederwall, JJ Yio, and SC Xie. 2001. “Objective Analysis of ARM IOP Data: Method and Sensitivity.” Monthly Weather Review, 129(2), 295-311, doi:10.1175/1520-0493(2001)129<0295:OAOAID>2.0.CO;2.
Tang S, S Xie, M Zhang, and S Endo. 2020. “Improvement of Atmospheric Objective Analysis Over Sloping Terrain and Its Impact on Shallow-Cumulus Clouds in Large-Eddy Simulations.” Journal of Geophysical Research: Atmospheres, 125(13), e2020JD032492, doi:10.1029/2020JD032492.
Xie S, RT Cederwall, and MH Zhang. 2004. “Developing long-term single-column model/cloud system–resolving model forcing data using numerical weather prediction products constrained by surface and top of the atmosphere observations.” Journal of Geophysical Research: Atmospheres, 109(D1), D01104, doi:10.1029/2003JD004045.
Follow Us:


Keep up with the Atmospheric Observer
Updates on ARM news, events, and opportunities delivered to your inbox
ARM User Profile
ARM welcomes users from all institutions and nations. A free ARM user account is needed to access ARM data.


