

Updated Surface Cloud Grid Data Now Available
Published: 25 January 2023
The Surface Cloud Grid value-added product (SFCCLDGRID VAP) has transitioned from evaluation to production. In support of that, the Atmospheric Radiation Measurement (ARM) user facility reprocessed historical data with the latest version of the VAP to meet current ARM data file standards. Also, new data have been generated from the production version of the VAP.
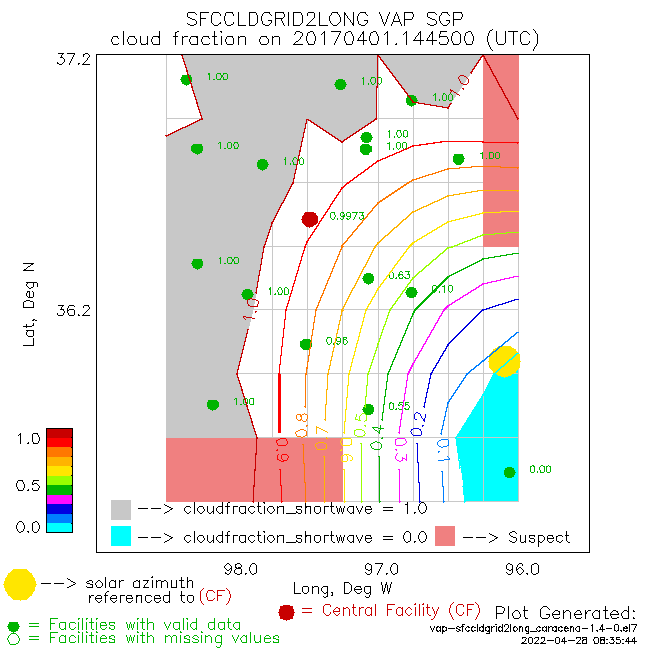
The SFCCLDGRID VAP compiles spatially distributed measurements of cloud and radiation properties over ARM’s Southern Great Plains atmospheric observatory. These values enable more accurate comparisons between model/satellite grid boxes and ground-based observations, as well as an estimate of the regional variability of cloud and radiation properties.
SFCCLDGRID produces two output datastreams. The first datastream (sfccldgrid2longcaracena) applies the Caracena (1987) technique to interpolate the measurements to a 0.25-by-0.25-degree latitude-longitude grid. The second datastream (sfccldgrid2longstation) provides 15-minute averages of the station-based cloud and radiation measurements from all Southern Great Plains facilities that are used to create the gridded product.
Historical SFCCLDGRID station data from January 1, 2009, through September 30, 2017, have been reprocessed. Also, historical gridded data from October 21, 2011, through September 30, 2017, have been reprocessed. The start date of the gridded reprocessed data was when the minimum number of 13 stations needed to create a gridded product was reached.
In addition, new station and gridded data from October 1, 2017, through May 31, 2020, are available for use.
Access the new and reprocessed data in the ARM Data Center. (Go here to create an account to download the data.)
Moving forward, SFCCLDGRID will be processed monthly using c1-level input data from the Radiative Flux Analysis (RADFLUXANAL) product. RADFLUXANAL calculates clear-sky irradiance in the shortwave and longwave surface fluxes from broadband irradiance measured at ARM sites. SFCCLDGRID data will be reprocessed yearly when RADFLUXANAL c2-level data become available. The c2 files include improved data for infrared loss correction.
More information about SFCCLDGRID can be found on the VAP web page. For questions about the VAP, please contact ARM translator Damao Zhang or developer Krista Gaustad.
To cite the SFCCLDGRID station data, please use doi:10.5439/1393587. To cite the gridded data, please use doi:10.5439/1393588.
Follow Us:


Keep up with the Atmospheric Observer
Updates on ARM news, events, and opportunities delivered to your inbox
ARM User Profile
ARM welcomes users from all institutions and nations. A free ARM user account is needed to access ARM data.


