

Convective Cell Tracking Database Now Available for CACTI Campaign
Published: 23 March 2022
A new database describes the properties of individually tracked convective cells during the Cloud, Aerosol, and Complex Terrain Interactions (CACTI) field campaign. The Atmospheric Radiation Measurement (ARM) user facility conducted the CACTI campaign in 2018 and 2019 in Argentina’s Sierras de Córdoba mountain range.
Using data from the second-generation C-Band Scanning ARM Precipitation Radar (CSAPR2) and other ARM instruments that operated during CACTI, the database gives details about the life cycle evolution of 6,895 individual convective cells and their local environmental conditions.
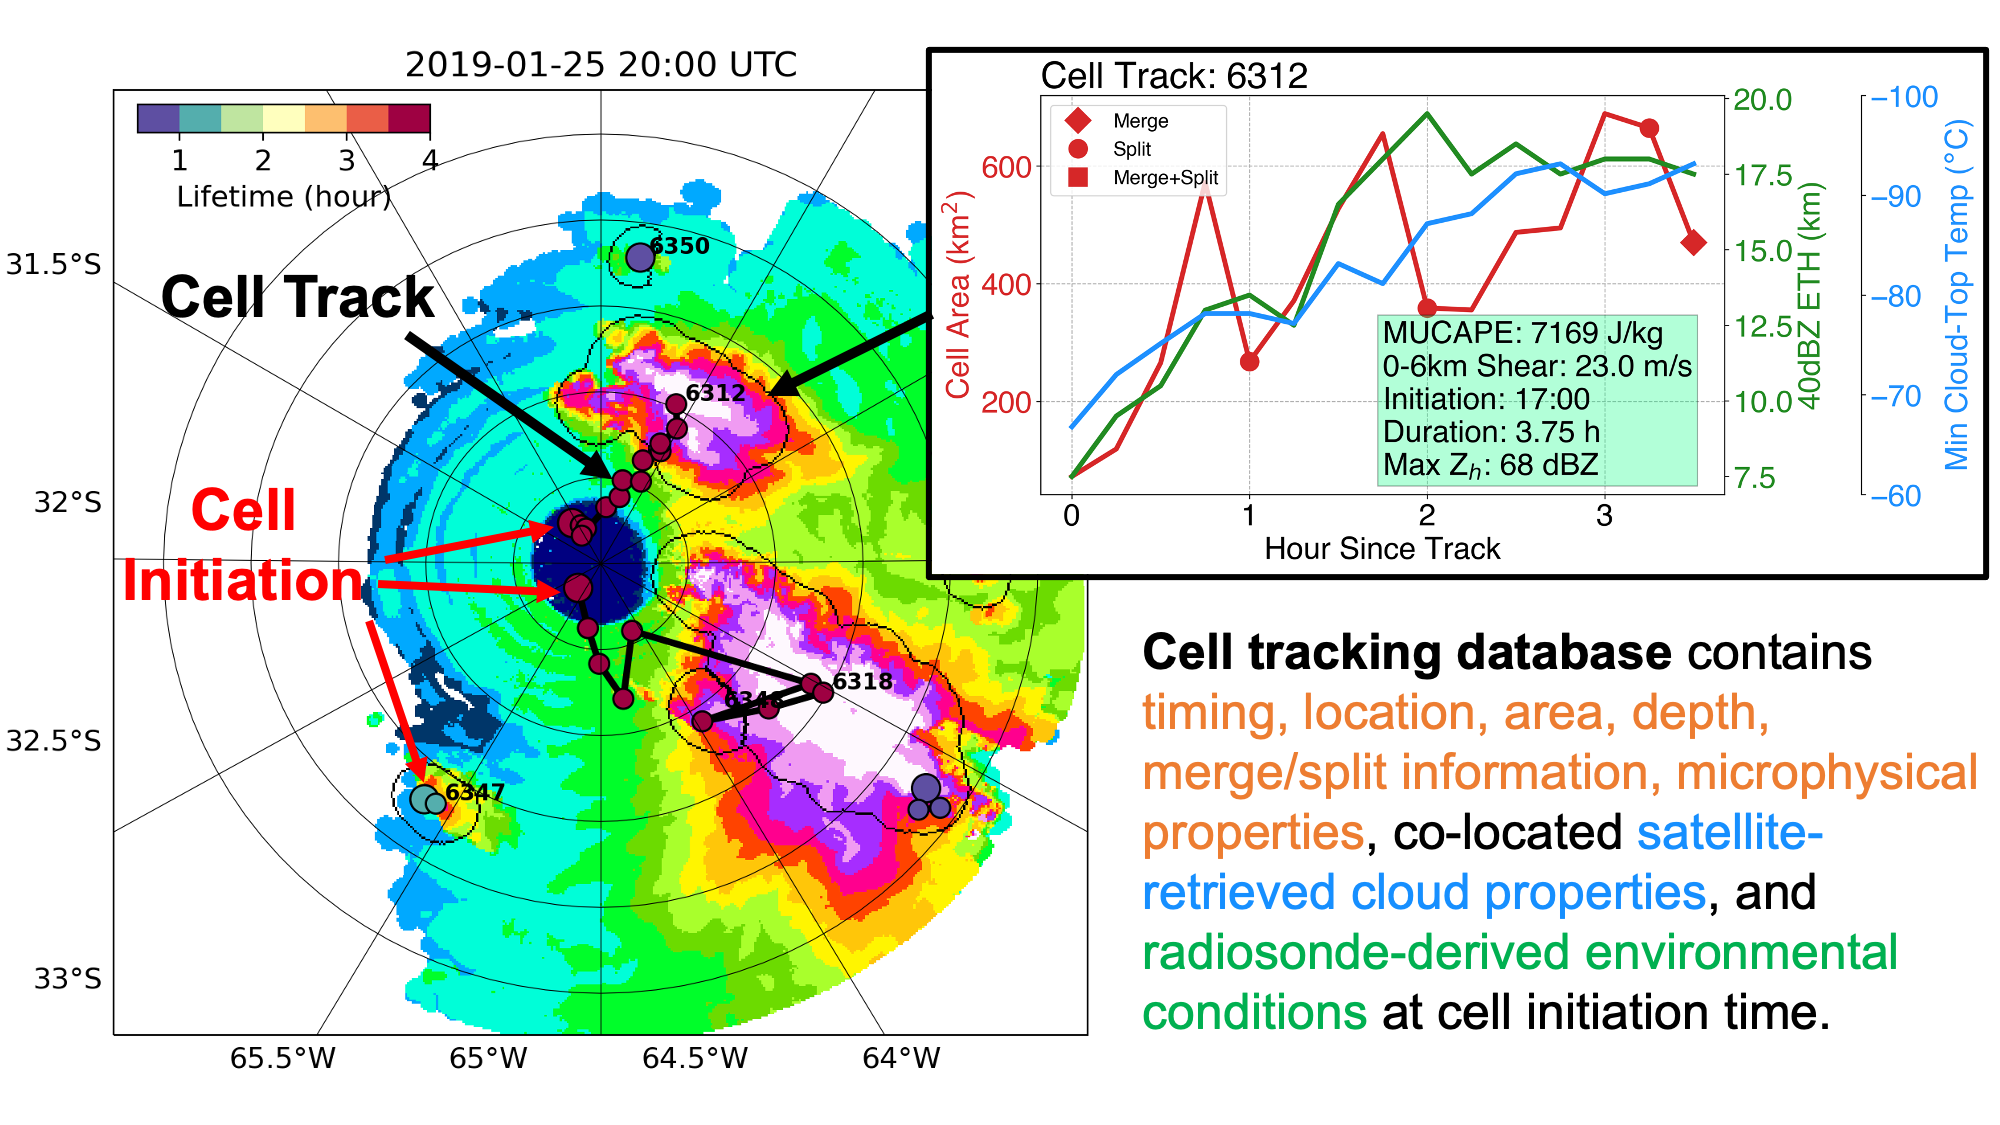
For each cell track, this principal investigator data product includes timing, location, area, depth, merge/split information, microphysical properties, co-located satellite-retrieved cloud properties, and radiosonde-derived environmental conditions. (Read more about the database work.)
The data set provides a baseline of convective cell initiation, growth, and decay history of individual cells. Researchers can use this information to study convection initiation, upscale growth, and how these processes are controlled by the nearby atmospheric environments.
To produce the database, researchers applied an updated version of a convective cell identification and tracking algorithm, the FLEXible object TRacKeR (FLEXTRKR) (Feng et al. 2022), to CSAPR2 data processed by the Taranis radar processing package (Hardin et al. 2020).
The database tracks cells captured during CACTI from October 15, 2018, to March 3, 2019. The full cell tracking for the campaign and the cell environmental conditions are available in one netCDF file. In addition, the data set also includes pixel-level data, which provide information about each cell at a given pixel (see example figure) and can be linked to cell track statistics (e.g., time). These data are produced on a Cartesian grid (500-meter resolution) based on the Taranis data.
Access the CACTI cell tracking data through the ARM Data Center. (Go here to create an account to download the data.)
Please refer to the README documentation to learn more about using the database. To ask questions or provide feedback, please contact Zhe Feng.
To cite information from the database, please use doi:10.5439/1844991.
References
Feng Z, A Varble, J Hardin, J Marquis, A Hunzinger, Z Zhang, and M Thieman. 2022. “Deep Convection Initiation, Growth and Environments in the Complex Terrain of Central Argentina during CACTI.” Monthly Weather Review, 10.1175/MWR-D-21-0237.1. ONLINE.
Hardin JC, N Bharadwaj, SE Giangrande, A Varble, and Z Feng. 2020. “Taranis: A New Framework for Physically Constrained Radar Processing.” Paper presented at the American Geophysical Union (AGU) Fall Meeting, virtual.
Follow Us:


Keep up with the Atmospheric Observer
Updates on ARM news, events, and opportunities delivered to your inbox
ARM User Profile
ARM welcomes users from all institutions and nations. A free ARM user account is needed to access ARM data.


