

New Value-Added Products Released for Scanning ARM Precipitation Radars
Published: 20 April 2020
Two new value-added products (VAPs) for the Atmospheric Radiation Measurement (ARM) user facility’s scanning precipitation radars are now available for evaluation. Both VAPs are designed to be easier to use and take up less data volume than raw radar data.
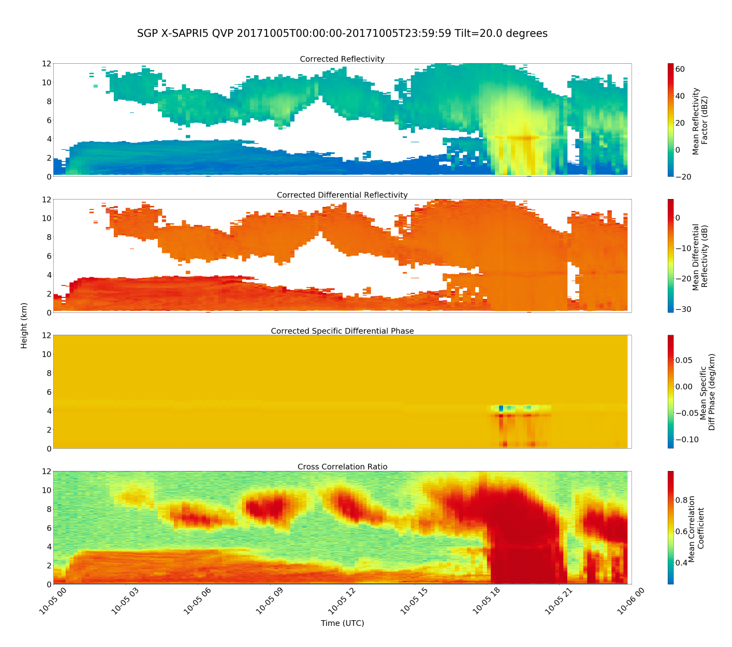
The Scanning ARM Precipitation Radar Quasi-Vertical Profiles (SAPRQVP) VAP averages quality-controlled radar measurements along the axis of the azimuth. SAPRQVP allows quick insight into domain mean hydrometeor (e.g., snow, rain, melting layer) location and polarimetric data.
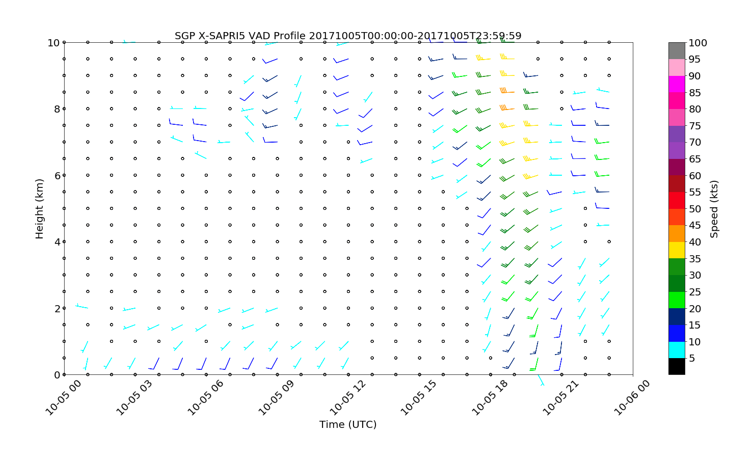
The SAPR Velocity Azimuth Display (SAPRVAD) product contains retrievals of the zonal (north/south) and meridional (east/west) wind speed components, in precipitating systems, as a function of time and height. This product, which uses azimuthal variations in radial air velocity, allows quick insight into wind speed and wind direction in the vicinity of the radar when rainfall or snowfall is present.
These products are derived from the Corrected Moments in Antenna Coordinates Version 2 (CMAC2) VAP. CMAC2 corrects raw precipitation radar data for atmospheric phenomena and Doppler velocity aliasing.
QVP and VAD data are derived from CMAC2 using code within the Python ARM Radar Toolkit (Py-ART), an open-source architecture for interacting with radar data in the Python programming language. With dramatically less data volume than CMAC2, the SAPRQVP and SAPRVAD data sets are ideal for initial investigation of cases for further study.
SAPRQVP and SAPRVAD contain data from the three X-Band Scanning ARM Precipitation Radars (XSAPRs) at ARM’s Southern Great Plains atmospheric observatory for the following date ranges:
- Intermediate facility I4 (Billings, Oklahoma): SAPRQVP—August 30, 2018, to January 19, 2019; SAPRVAD—August 30, 2018, to January 22, 2019
- I5 (Garber, Oklahoma): SAPRQVP and SAPRVAD—October 1, 2017, to February 18, 2019
- I6 (Deer Creek, Oklahoma): SAPRQVP and SAPRVAD—August 30, 2018, to February 26, 2019.
Scientists can use the XSAPRQVP and XSAPRVAD datastreams now. Data will be added on an episodic basis. Also, C-Band Scanning ARM Precipitation Radar (CSAPR) data will eventually be available from both SAPRQVP and SAPRVAD.
For more information on these VAPs, go to the SAPRQVP and SAPRVAD web pages.
SAPRQVP and SAPRVAD are evaluation VAPs that are being actively developed and tested. Please contact the radar translator, Scott Collis, if you are using them. Feedback is welcomed and encouraged. If you find any issues in the data, please contact Collis so they can be rectified.
Access the XSAPRQVP and XSAPRVAD datastreams in the ARM Data Center. (Go here to create an account to download the data.)
To cite the data, use doi:10.5439/1506645 for SAPRQVP and doi:10.5439/1606006 for SAPRVAD.
Follow Us:


Keep up with the Atmospheric Observer
Updates on ARM news, events, and opportunities delivered to your inbox
ARM User Profile
ARM welcomes users from all institutions and nations. A free ARM user account is needed to access ARM data.


