

Gridded Scanning Cloud Radar Products Released for TRACER Field Campaign
Published: 7 July 2025
The Atmospheric Radiation Measurement (ARM) User Facility released a new set of four cloud radar value-added products (VAPs) for the 2021–2022 TRacking Aerosol Convection interactions ExpeRiment (TRACER) in the Houston, Texas, area.
The Scanning ARM Cloud Radar Grid (SACRGRID) family of VAPs provides radar moments and derived quantities from scanning cloud radars on a Cartesian grid to make it easier for scientists to use TRACER’s scanning ARM cloud radar observations.
The SACRGRID VAP releases for TRACER consist of gridded range-height indicator (RHI) and plan position indicator (PPI) scans from the Ka-Band Scanning ARM Cloud Radar (KASACR) and X-Band Scanning ARM Cloud Radar (XSACR).
All four VAPs, which are available in evaluation mode, use b1-level calibrated radar data as input. The calibrated gridded radar moments provided by these VAPs include reflectivity, mean Doppler velocity, spectral width, signal-to-noise ratio, differential phase, and differential reflectivity.
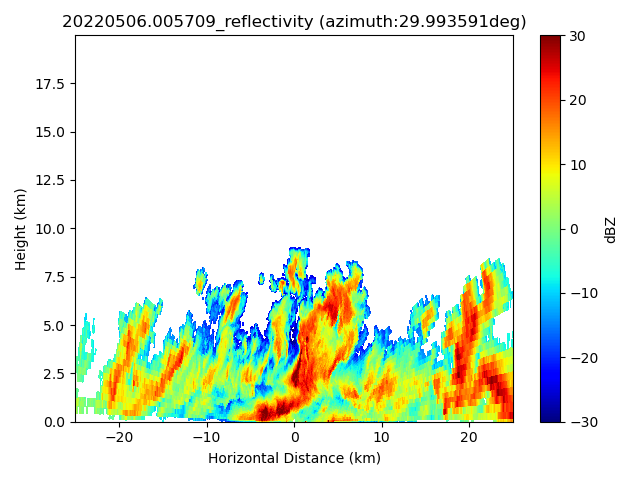
The KASACRGRIDRHI and XSACRGRIDRHI VAPs remap RHI-type scans onto a Cartesian grid. During TRACER, ARM employed the Hemispheric Sky RHI (HSRHI) scan strategy, which consisted of consecutive horizon-to-vertical scans (elevation angles from 0 to 150 degrees) at azimuths of 0, 30, 60, 90, 120, and 150 degrees.
Input data for both VAPs are b1-level calibrated HSRHI data. Gridding is performed using a nearest neighbor algorithm, with a censor mask applied to identify significant echoes, such as clutter, clouds, and precipitation. Gaseous attenuation correction is applied to the KASACR data before gridding to eliminate water vapor as a source of signal attenuation.
The output is a single c1-level netCDF file with calibrated radar moments remapped onto a two-dimensional (2D) Cartesian grid.
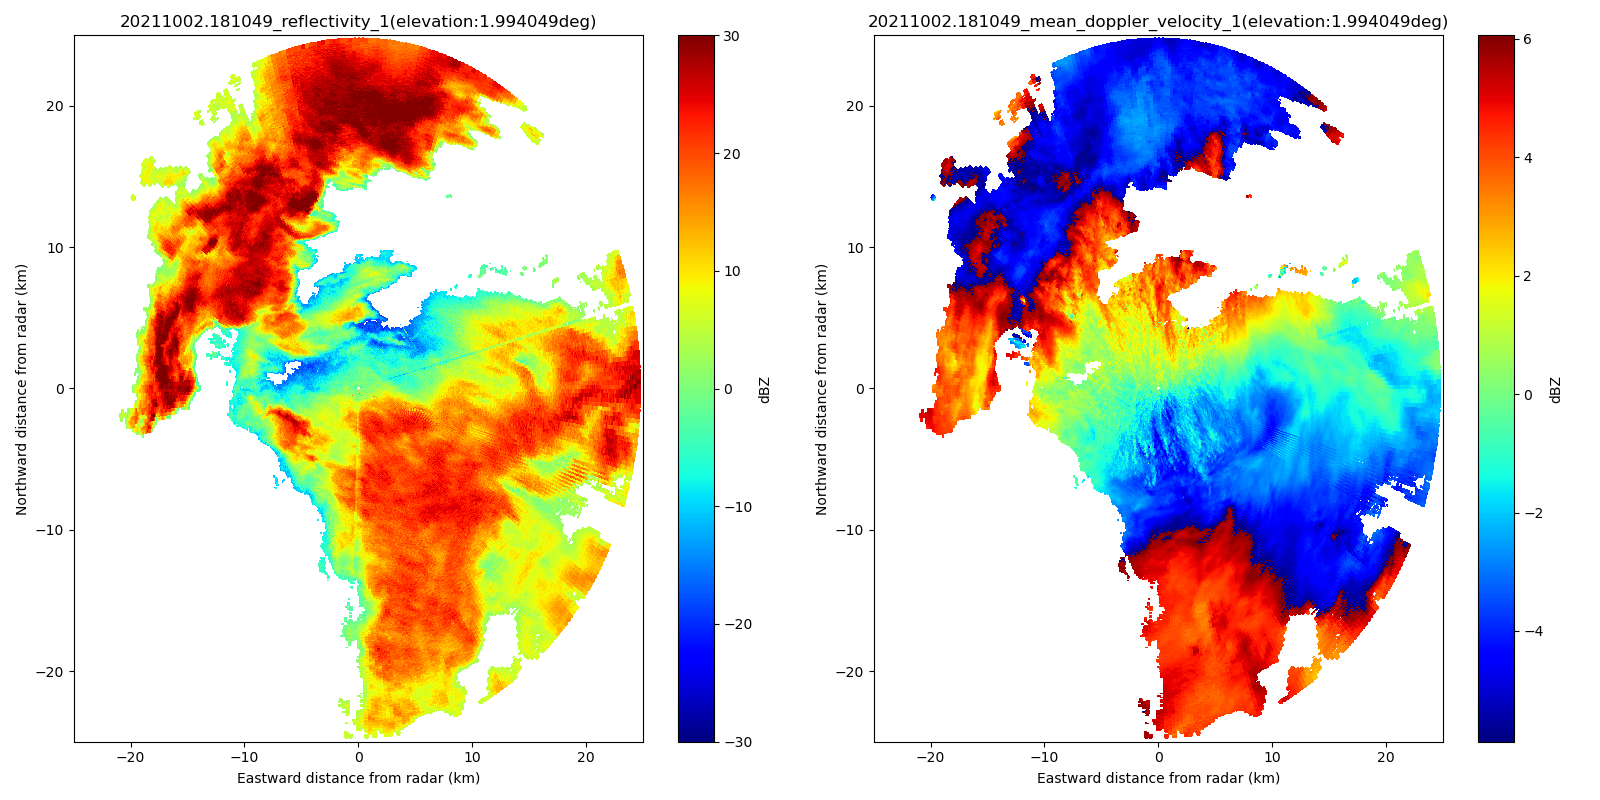
The KASACRGRIDPPI and XSACRGRIDPPI VAPs remap PPI-type scans onto a Cartesian grid. The PPI scan strategy used during TRACER consisted of consecutive 360-degree surveillance scans with elevation angles from 1 to 2 degrees.
Input data for both VAPs are b1-level calibrated PPI data. The gridding process is done in a similar way as for KASACRGRIDRHI and XSACRGRIDRHI.
The output data are calibrated c1-level netCDF files, each comprising gridded observations for a single azimuthal scan. Surveillance scans are gridded for elevations of 1 and 2 degrees. Output variables include the calibrated radar moments remapped onto a 2D Cartesian grid.
Scientists can access the data and additional information about the VAPs on the web pages for KASACRGRIDRHI, KASACRGRIDPPI, XSACRGRIDRHI, and XSACRGRIDPPI. (To download the data, first create an ARM account.)
KASACRGRIDRHI and KASACRGRIDPPI are available for the full length of TRACER from October 1, 2021, through September 30, 2022. XSACRGRIDRHI and XSACRGRIDPPI are available for TRACER from October 1, 2021, through September 21, 2022, which is when the XSACR input data ended. The XSACR and KASACR operated at the ARM Mobile Facility site in La Porte, Texas.
Users are encouraged to provide feedback on the quality and accuracy of these evaluation data before SACRGRID VAPs move into production mode. To give feedback or ask questions about the data, please contact VAP developer Meng Wang or ARM translator Dié Wang.
To cite the data, please use the following DOIs:
- KASACRGRIDRHI – doi:10.5439/1645175.
- KASACRGRIDPPI – doi:10.5439/1886546.
- XSACRGRIDRHI – doi:10.5439/1645174.
- XSACRGRIDPPI – doi:10.5439/2000081.
Follow Us:


Keep up with the Atmospheric Observer
Updates on ARM news, events, and opportunities delivered to your inbox
ARM User Profile
ARM welcomes users from all institutions and nations. A free ARM user account is needed to access ARM data.


