
Your Introductory Guide to TRACER Data
Published: 27 June 2023
Editor’s note: Michael Jensen, principal investigator for the 2021–2022 TRacking Aerosol Convection interactions ExpeRiment (TRACER), provided the following blog post.
After TRACER’s field operations period ended about eight months ago in the Houston, Texas, area, those involved turned to further assessing the quality of the data that were collected, analyzing the data, developing more advanced data products, and preparing for modeling studies. ARM instrument mentors, translator and developer teams, scientists, postdocs, and graduate students have all been working to release data to the ARM Data Center.
In early June 2023, a search via ARM Data Discovery returned 170 TRACER datastreams, including instrument datastreams, value-added products, data products from the summer 2022 intensive operational period, external data products, and principal investigator (PI) data products. This number grows as more complex data sets are delivered.
The ARM Data Center is also receiving and archiving data from TRACER-related campaigns.
Whether you are looking to peruse data on clouds, aerosols, meteorology, precipitation, or radiation, many established ARM datastreams and then some are freely available through Data Discovery. (You will need to create an account to download the data.)
So, if you are interested in finding out more about the TRACER data set but are not sure where to start, here are just a few entry points that might help you decide.
Meteorology, Clouds, and Aerosols
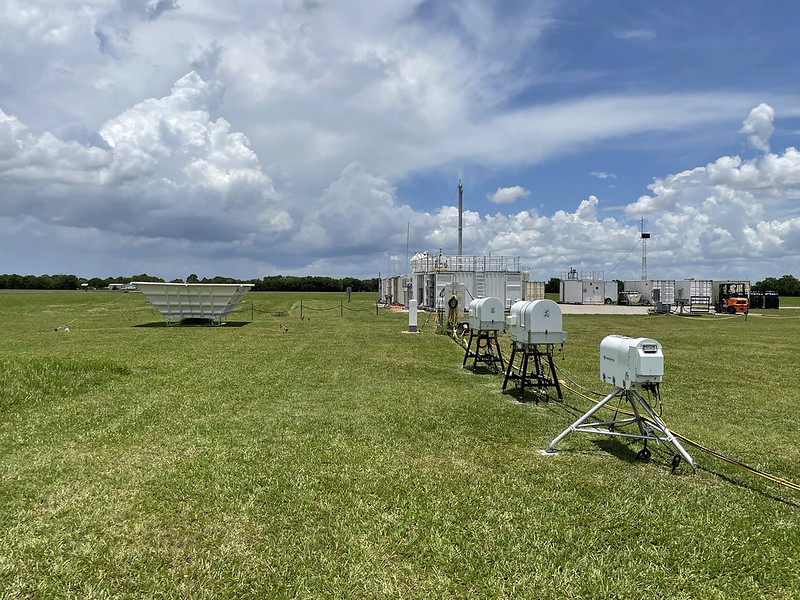
If you are looking to understand some of the overall meteorological conditions during the campaign, you may check out the time series of surface meteorological measurements (labeled as the met data product in Data Discovery) that provides surface temperature, pressure, relative humidity, and wind speed and direction, or the profiles of these variables measured by radiosondes (sondewnpn).
Another data set that may be of interest is the radiosonde data (imet) collected by Texas A&M University (TAMU) on convective days near the coast in the morning and then farther inland during the afternoon in the continental air mass.
For researchers interested in all things clouds, a good place to start would be the Ka-Band ARM Zenith Radar Active Remote Sensing of CLouds (KAZRARSCL) value-added product (arsclkazr1kollias and arsclkazrbnd1kollias). KAZRARSCL combines measurements from the KAZR, micropulse lidar, and microwave radiometer to provide best estimates of cloud boundaries and radar moments. Another data set that provides an overall picture of the changing cloud conditions is the fractional sky coverage from the total sky imager (tsiskycover). And finally, if you are looking for a broader picture of the cloud properties of the entire TRACER domain, the SatCORPS satellite data products from the NASA Langley Cloud and Radiation Research Group (visstgridg16v4minnis and visstpx2dg16minnis) provide detailed imagery and retrieved properties from the GOES-16 measurements.
An important component of TRACER science is the life cycle of aerosols in the convective environment. For those interested in the details of the aerosols in Houston, the measurements from the ARM Aerosol Observing System (AOS) provide a one-stop shop for most of your needs. The AOS observations (see any datastream beginning with aos) include measurements of aerosol concentration and size distribution, chemical composition, hygroscopicity, and radiative and optical properties.
Other available aerosol-related data sets in the ARM Data Center are those from the groups at Los Alamos National Laboratory and the University of California, Davis, focused on carbonaceous aerosols (found under the TRACER-CAT-LANL and TRACER-CAT-UCDavis campaigns in Data Discovery) and measurements of the regional variability of aerosol properties from the TRACER-MAP (Mapping Aerosol across Houston) and TRACER-TAMU campaign teams.
Different Flavors of Data
TRACER included a number of measurements that are unique for ARM.
One of the highlights is the C-Band Scanning ARM Precipitation Radar cell-tracking data set (csapr), a PI product submitted by Mariko Oue from Stony Brook University. This data set provides the first synopsis of the convective cells that were tracked using the Multisensor Agile Adaptive Sampling algorithm. It also gives users data on the locations of the targeted cells, radar reflectivity and polarimetric radar variables, and radial velocity.
The TRACER-UAS (Uncrewed Aerial System) campaign, a joint effort between researchers at the University of Colorado and University of Oklahoma, collected important profiles of boundary-layer thermodynamics and aerosols at locations approximately halfway between the coasts and ARM sites. TRACER-UAS sampled a number of interesting sea breeze passages and convective outflow events.
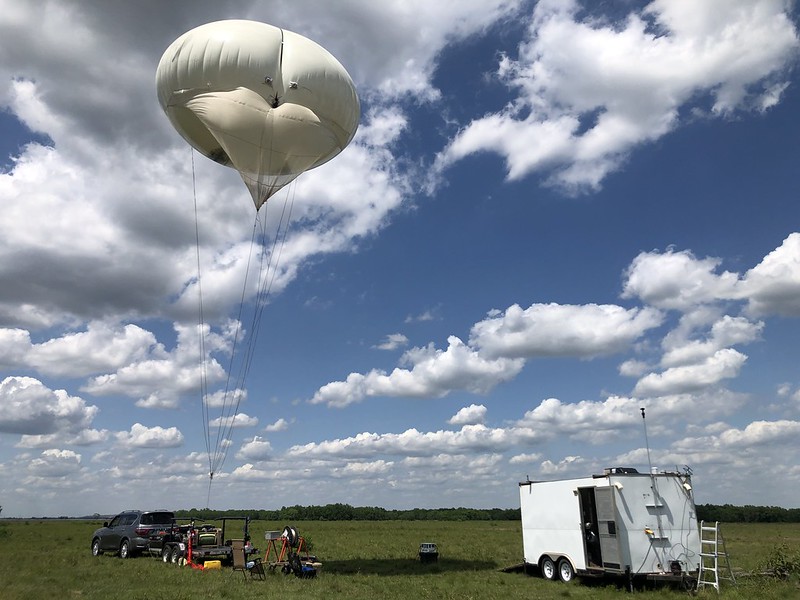
ARM’s tethered balloon system (TBS) operated at the ancillary site in Guy, Texas, during the first two weeks of each month of TRACER’s intensive operational period from June through September 2022. ARM conducted 150 flights over 49 days of operations. The TBS performed profiling and loitering ascents, with varying instrument packages collecting measurements of atmospheric state, aerosols, and trace gases. Many of the data sets collected during the TBS flights are already available through ARM Data Discovery.
Need Help?
This menu of available TRACER data is by no means exhaustive. Instead, it is meant to highlight just a few of the interesting measurements that you can access to get a flavor for the conditions sampled during the campaign. Many other important data sets are available, with more coming in regularly.
Links to related campaigns are available on the TRACER web page. When data are available from a specific campaign, the campaign page will have a green button in the top right-hand corner where you can click to browse its data in Data Discovery.
If you have any questions about using data from TRACER or its related campaigns, please contact the PI of a specific campaign or send your data questions to ARM.
Follow Us:


Keep up with the Atmospheric Observer
Updates on ARM news, events, and opportunities delivered to your inbox
ARM User Profile
ARM welcomes users from all institutions and nations. A free ARM user account is needed to access ARM data.


