

ARM Instruments Detect Pressure Wave From Tongan Volcano Eruption
Published: 2 February 2022
The massive Hunga Tonga-Hunga Haʻapai volcanic eruption caused changes in atmospheric pressure that registered at ARM sites around the world.
The eruption happened at approximately 5:10 p.m. local time (04:10 Coordinated Universal Time, or UTC) on Saturday, January 15. (UTC is five hours ahead of Eastern Standard Time.)
ARM’s Surface Meteorology (MET) Systems at its Southern Great Plains (SGP), North Slope of Alaska (NSA), and Eastern North Atlantic (ENA) atmospheric observatories caught the reflected pressure wave. So did the MET systems deployed for the TRacking Aerosol Convection interactions ExpeRiment (TRACER) in La Porte, Texas, and the Surface Atmosphere Integrated Field Laboratory (SAIL) campaign in Gothic, Colorado.
Alyssa Sockol from the ARM Data Quality Office provided information about the pressure wave:
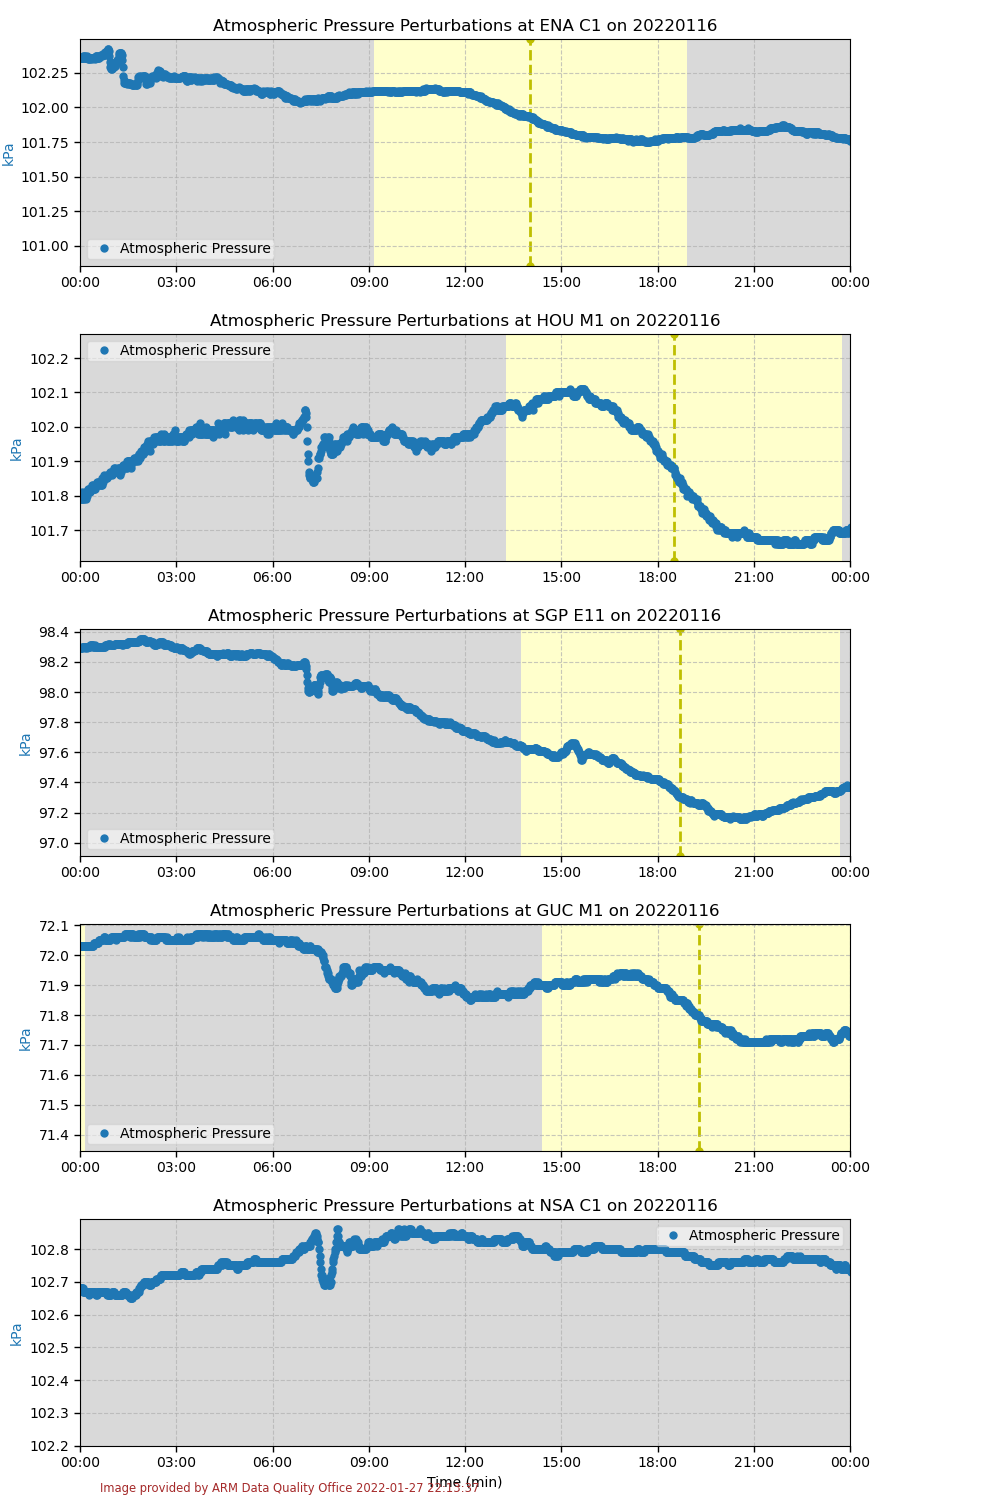
The plot (at right) shows the atmospheric pressure perturbations from the ARM MET instruments at various sites due to the Tonga eruption. The eruption sent a shockwave outward in all directions, quickly compressing the air. Our MET instruments were able to detect and measure this quick change in pressure. The pressure perturbations shown depict the reflected wave from the eruption, as this was more noticeable and easier to spot on our MET instruments than the initial wave.
Starting from the top graph in the plot, you can see a pressure perturbation beginning at approximately 01:00 UTC on Sunday, January 16, recorded from the MET instruments at ENA. The early arrival of the pressure perturbation from the reflected wave at this site makes sense, as ENA is the farthest east of the sites.
Below that, we can see more pressure perturbations recorded from the MET instruments at HOU (TRACER), SGP, GUC (SAIL), and NSA, moving from east to west. These perturbations all start between 06:00 and 08:00 UTC, since these four sites are much farther west than ENA.
Download Related ARM Data
ARM has collected the evidence of the atmospheric pressure perturbation from the Tongan volcano eruption as a data epoch. ARM data epochs identify high-quality data over a specific time range of scientific interest.
The new epoch comprises SGP, NSA, ENA, SAIL, and TRACER MET data from January 16. It also includes precipitation meteorological instrument (PRECIPMET) data from the SGP.
Access the data now in the ARM Data Center. (Go here to create an account to download the data.)
More Reading
- ARM user Neil Lareau, an assistant professor at the University of Nevada, Reno, discusses some atmospheric effects of the eruption with Nevada Today.
Follow Us:


Keep up with the Atmospheric Observer
Updates on ARM news, events, and opportunities delivered to your inbox
ARM User Profile
ARM welcomes users from all institutions and nations. A free ARM user account is needed to access ARM data.


