

How to ACT With ARM’s Data Quality Information!
Published: 9 June 2021
Editor’s note: ARM Instrument Operations Manager Adam Theisen from Argonne National Laboratory provided the following post about the Atmospheric data Community Toolkit (ACT). The ACT team will present a poster from 3 to 4 p.m. Eastern time on Wednesday, June 23, during the 2021 Joint ARM User Facility/ASR Principal Investigators Meeting.

Data quality (DQ) information can be found in different places and formats as explained on ARM’s Understanding Data Quality web page. Many embedded quality control (QC) variables in ARM’s data products are bit-packed, which means that multiple tests can be flagged at the same time. In addition, if problems are discovered with the data, a Data Quality Report (DQR) is created to alert data users. These DQRs are visible through ARM Data Discovery, included with data orders, and available through a web service.
This all sounds great, but it can also become overwhelming very quickly when starting to work with and visualize this information! That’s where the Atmospheric data Community Toolkit (ACT) can help! ACT is an open-source library that provides code for all parts of the data exploration life cycle.
For this example, we’ll use data from the newly upgraded multifilter rotating shadowband radiometer, which includes a new 1625 nm channel, at the Southern Great Plains E11 site near Byron, Oklahoma. Specifically, we will look at the diffuse hemispheric narrowband irradiance for filter 4 (673 nm).
The first thing I do when downloading data through ARM’s Live Data Web Service, using this ACT function in the same script, is visualize them (first plot). Note that all times in these plots are in UTC (Coordinated Universal Time), which is five hours ahead of Byron.
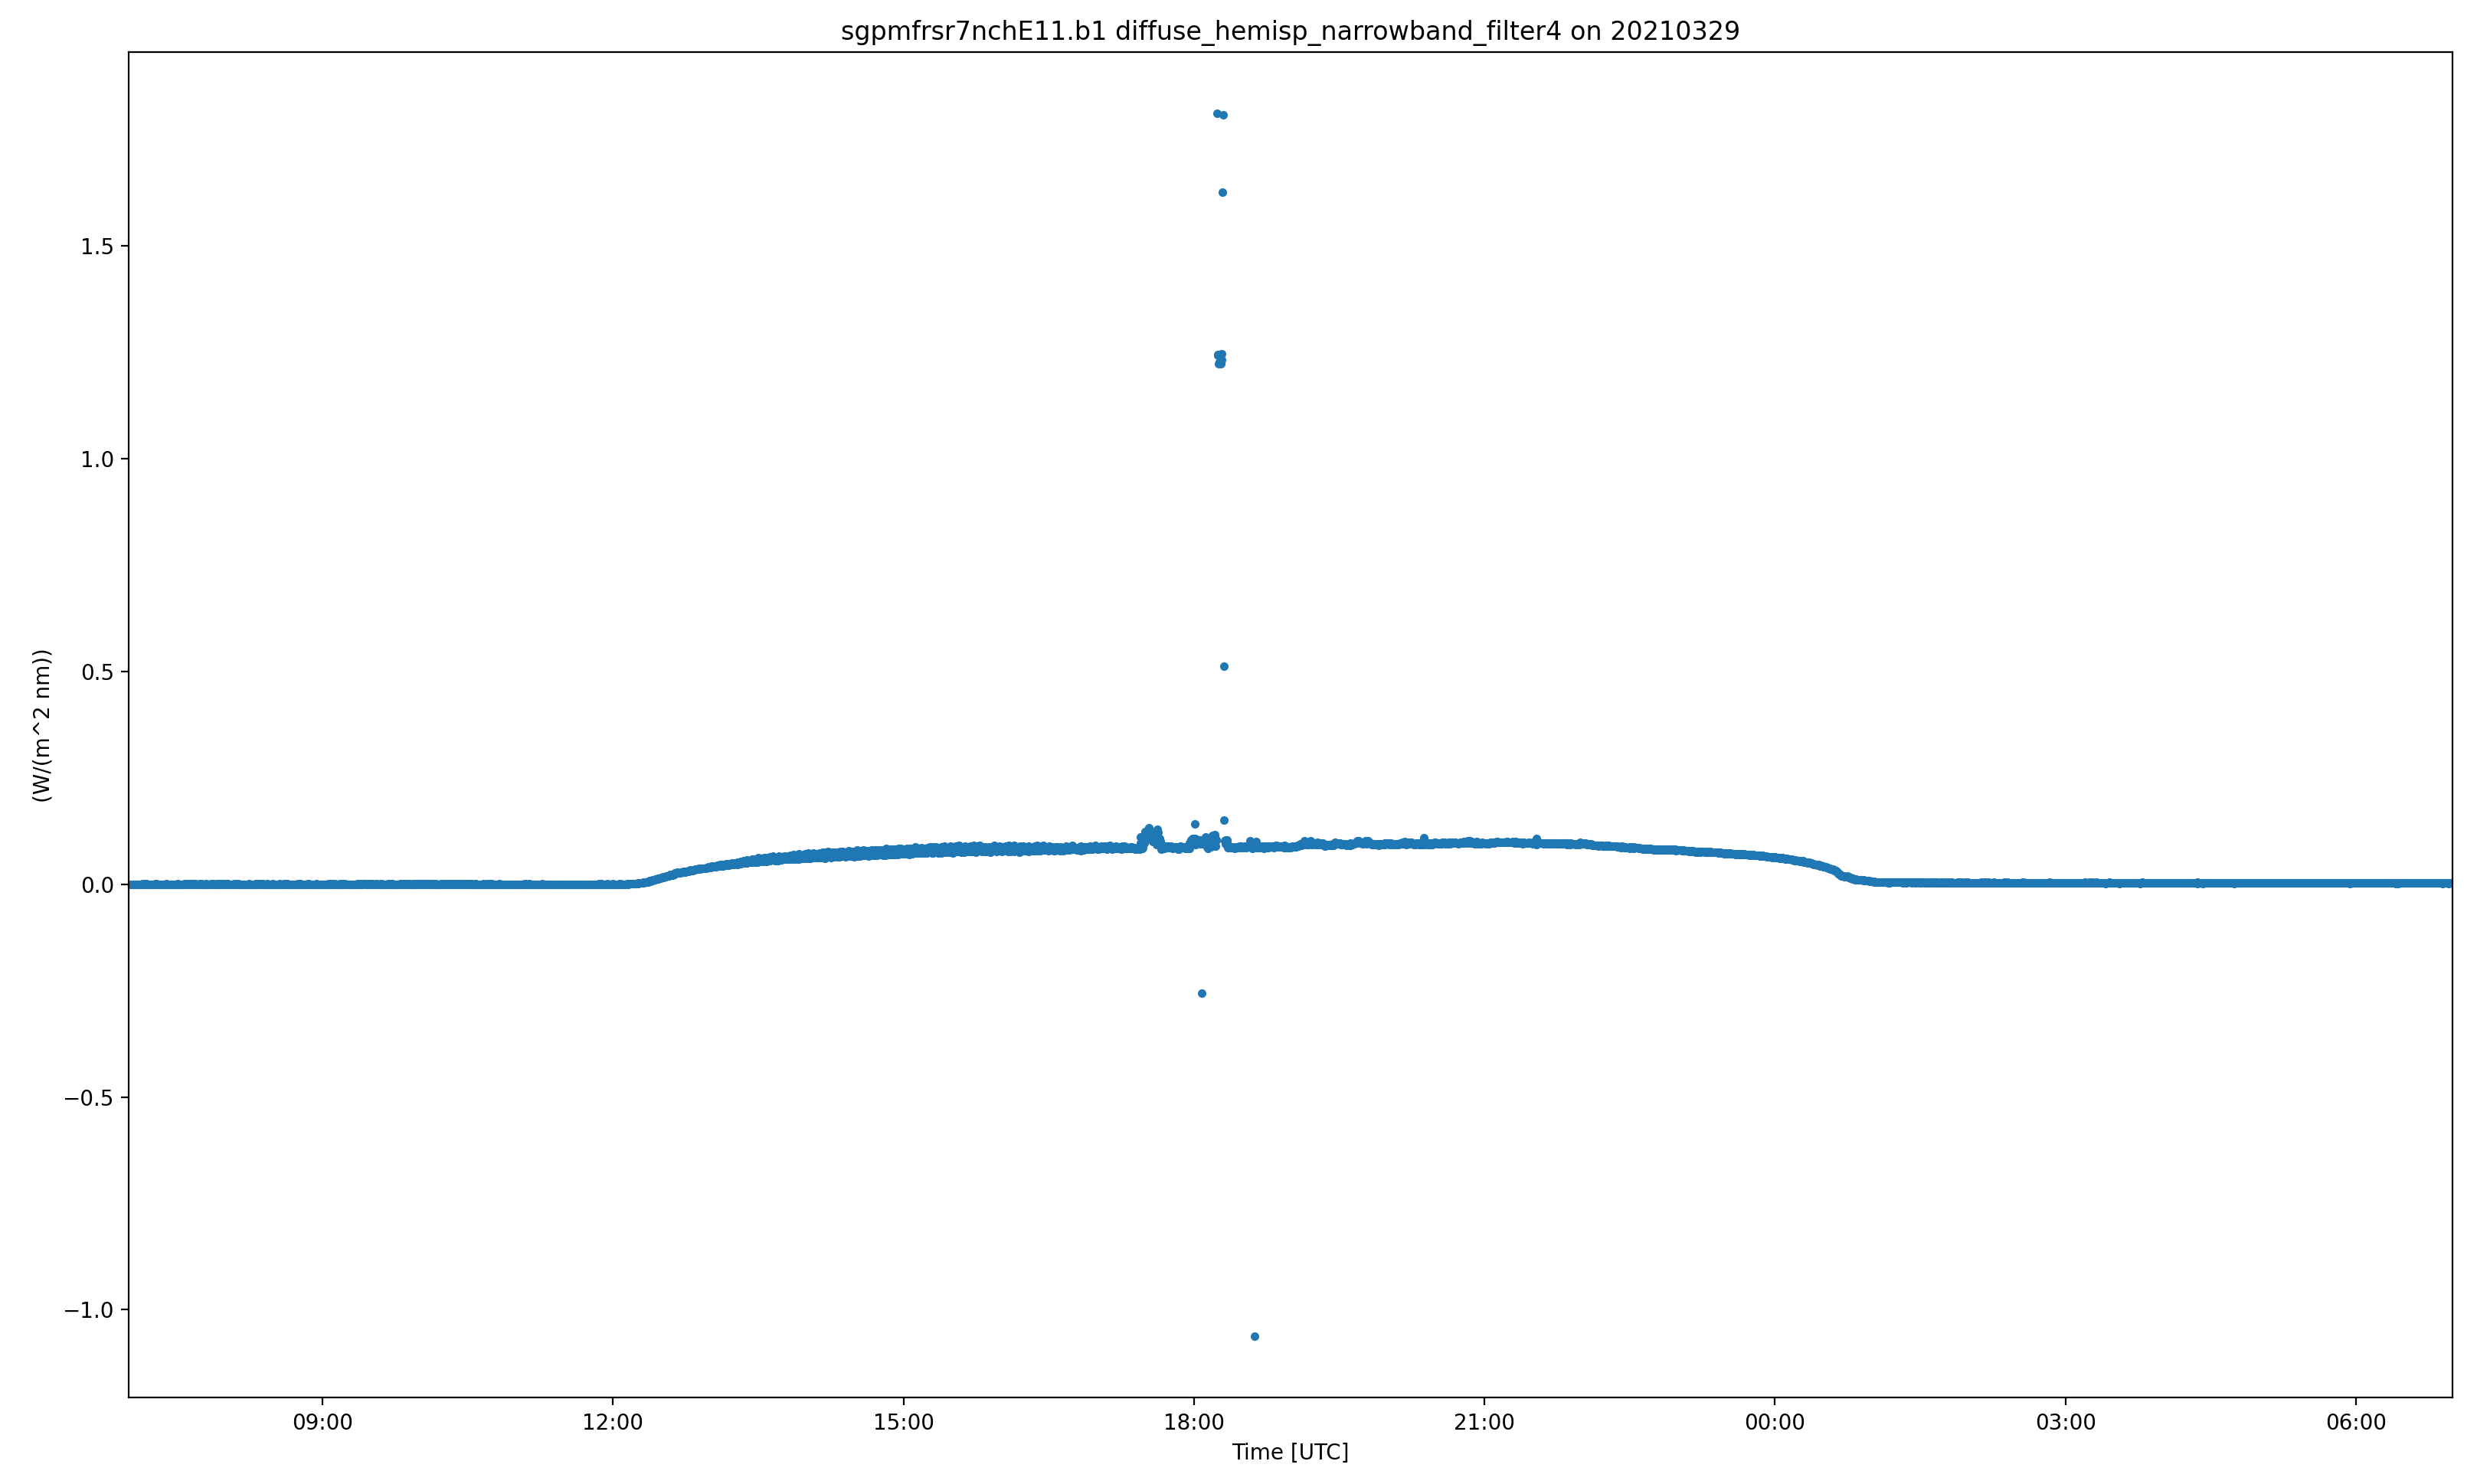
As seen in the first plot, there is something interesting going on, but how can we explore this more? With radiation measurements, it helps to add in a day/night background. This background is shaded yellow during daylight hours and gray during the night with a dashed gold line plotted vertically at solar noon (second plot). While we’re at it, we can clean up the files to be CF-compliant so we can easily use the QC modules in ACT and plot up the embedded QC variables (green/red QC block plot).
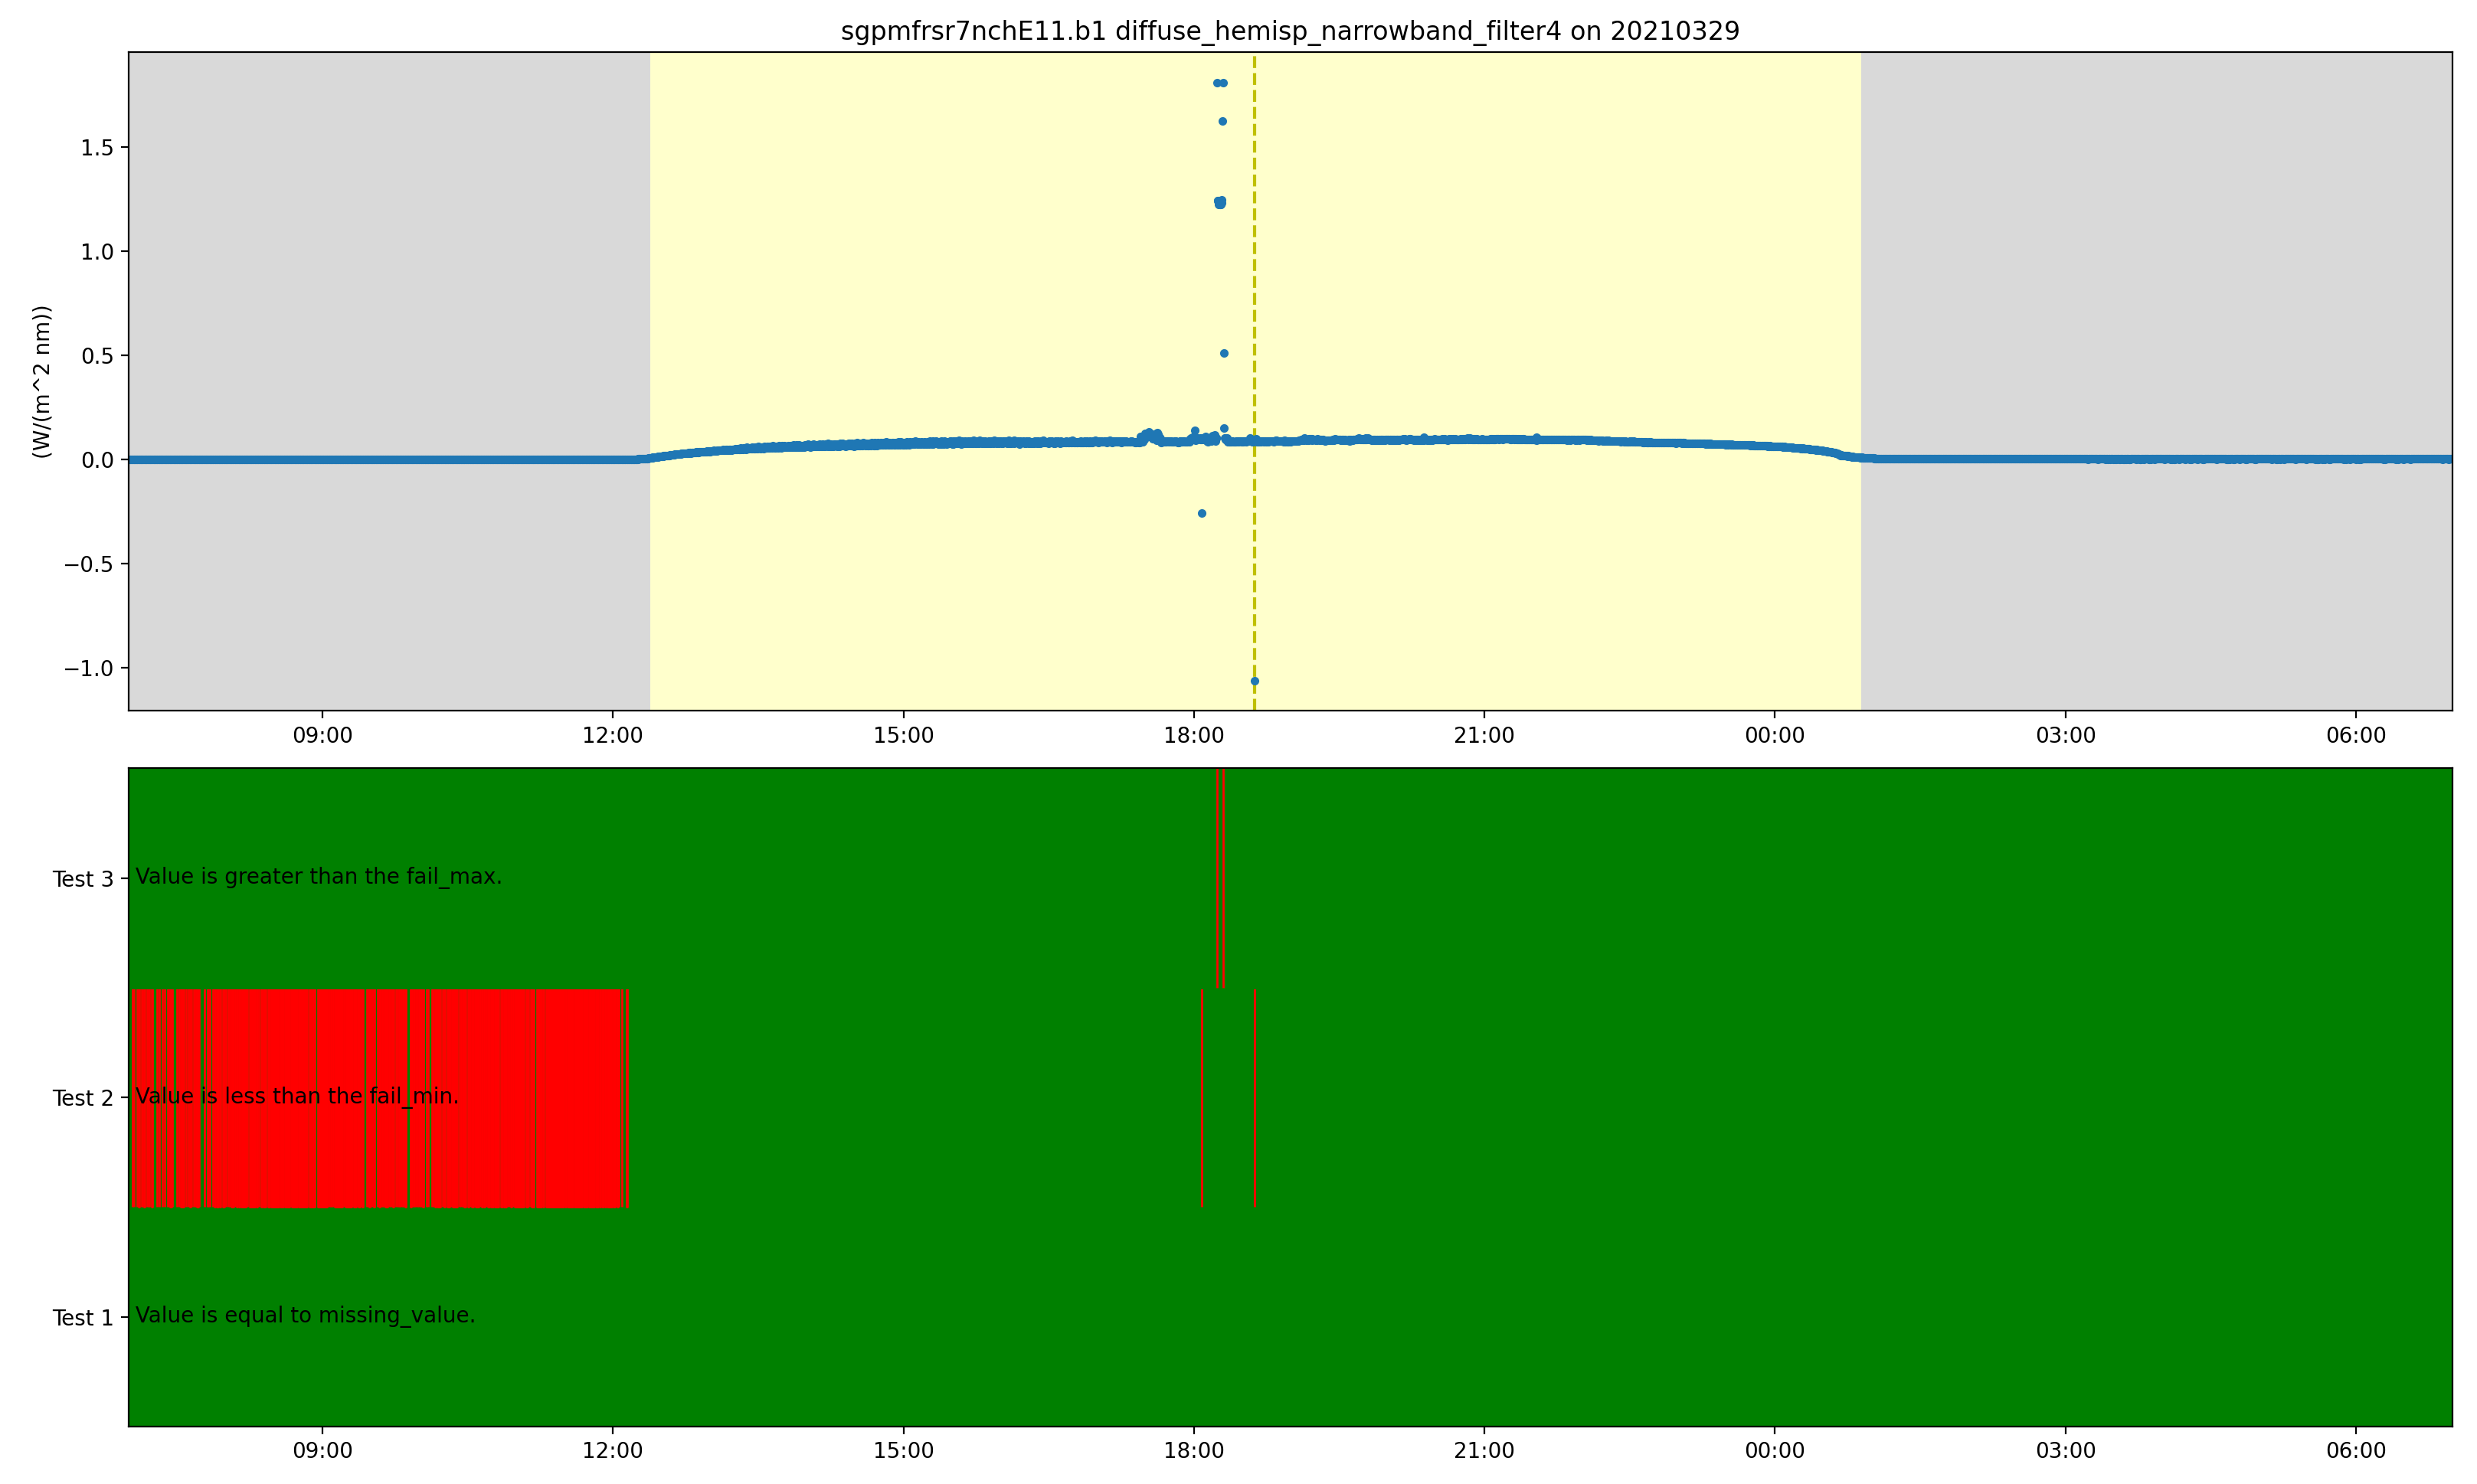
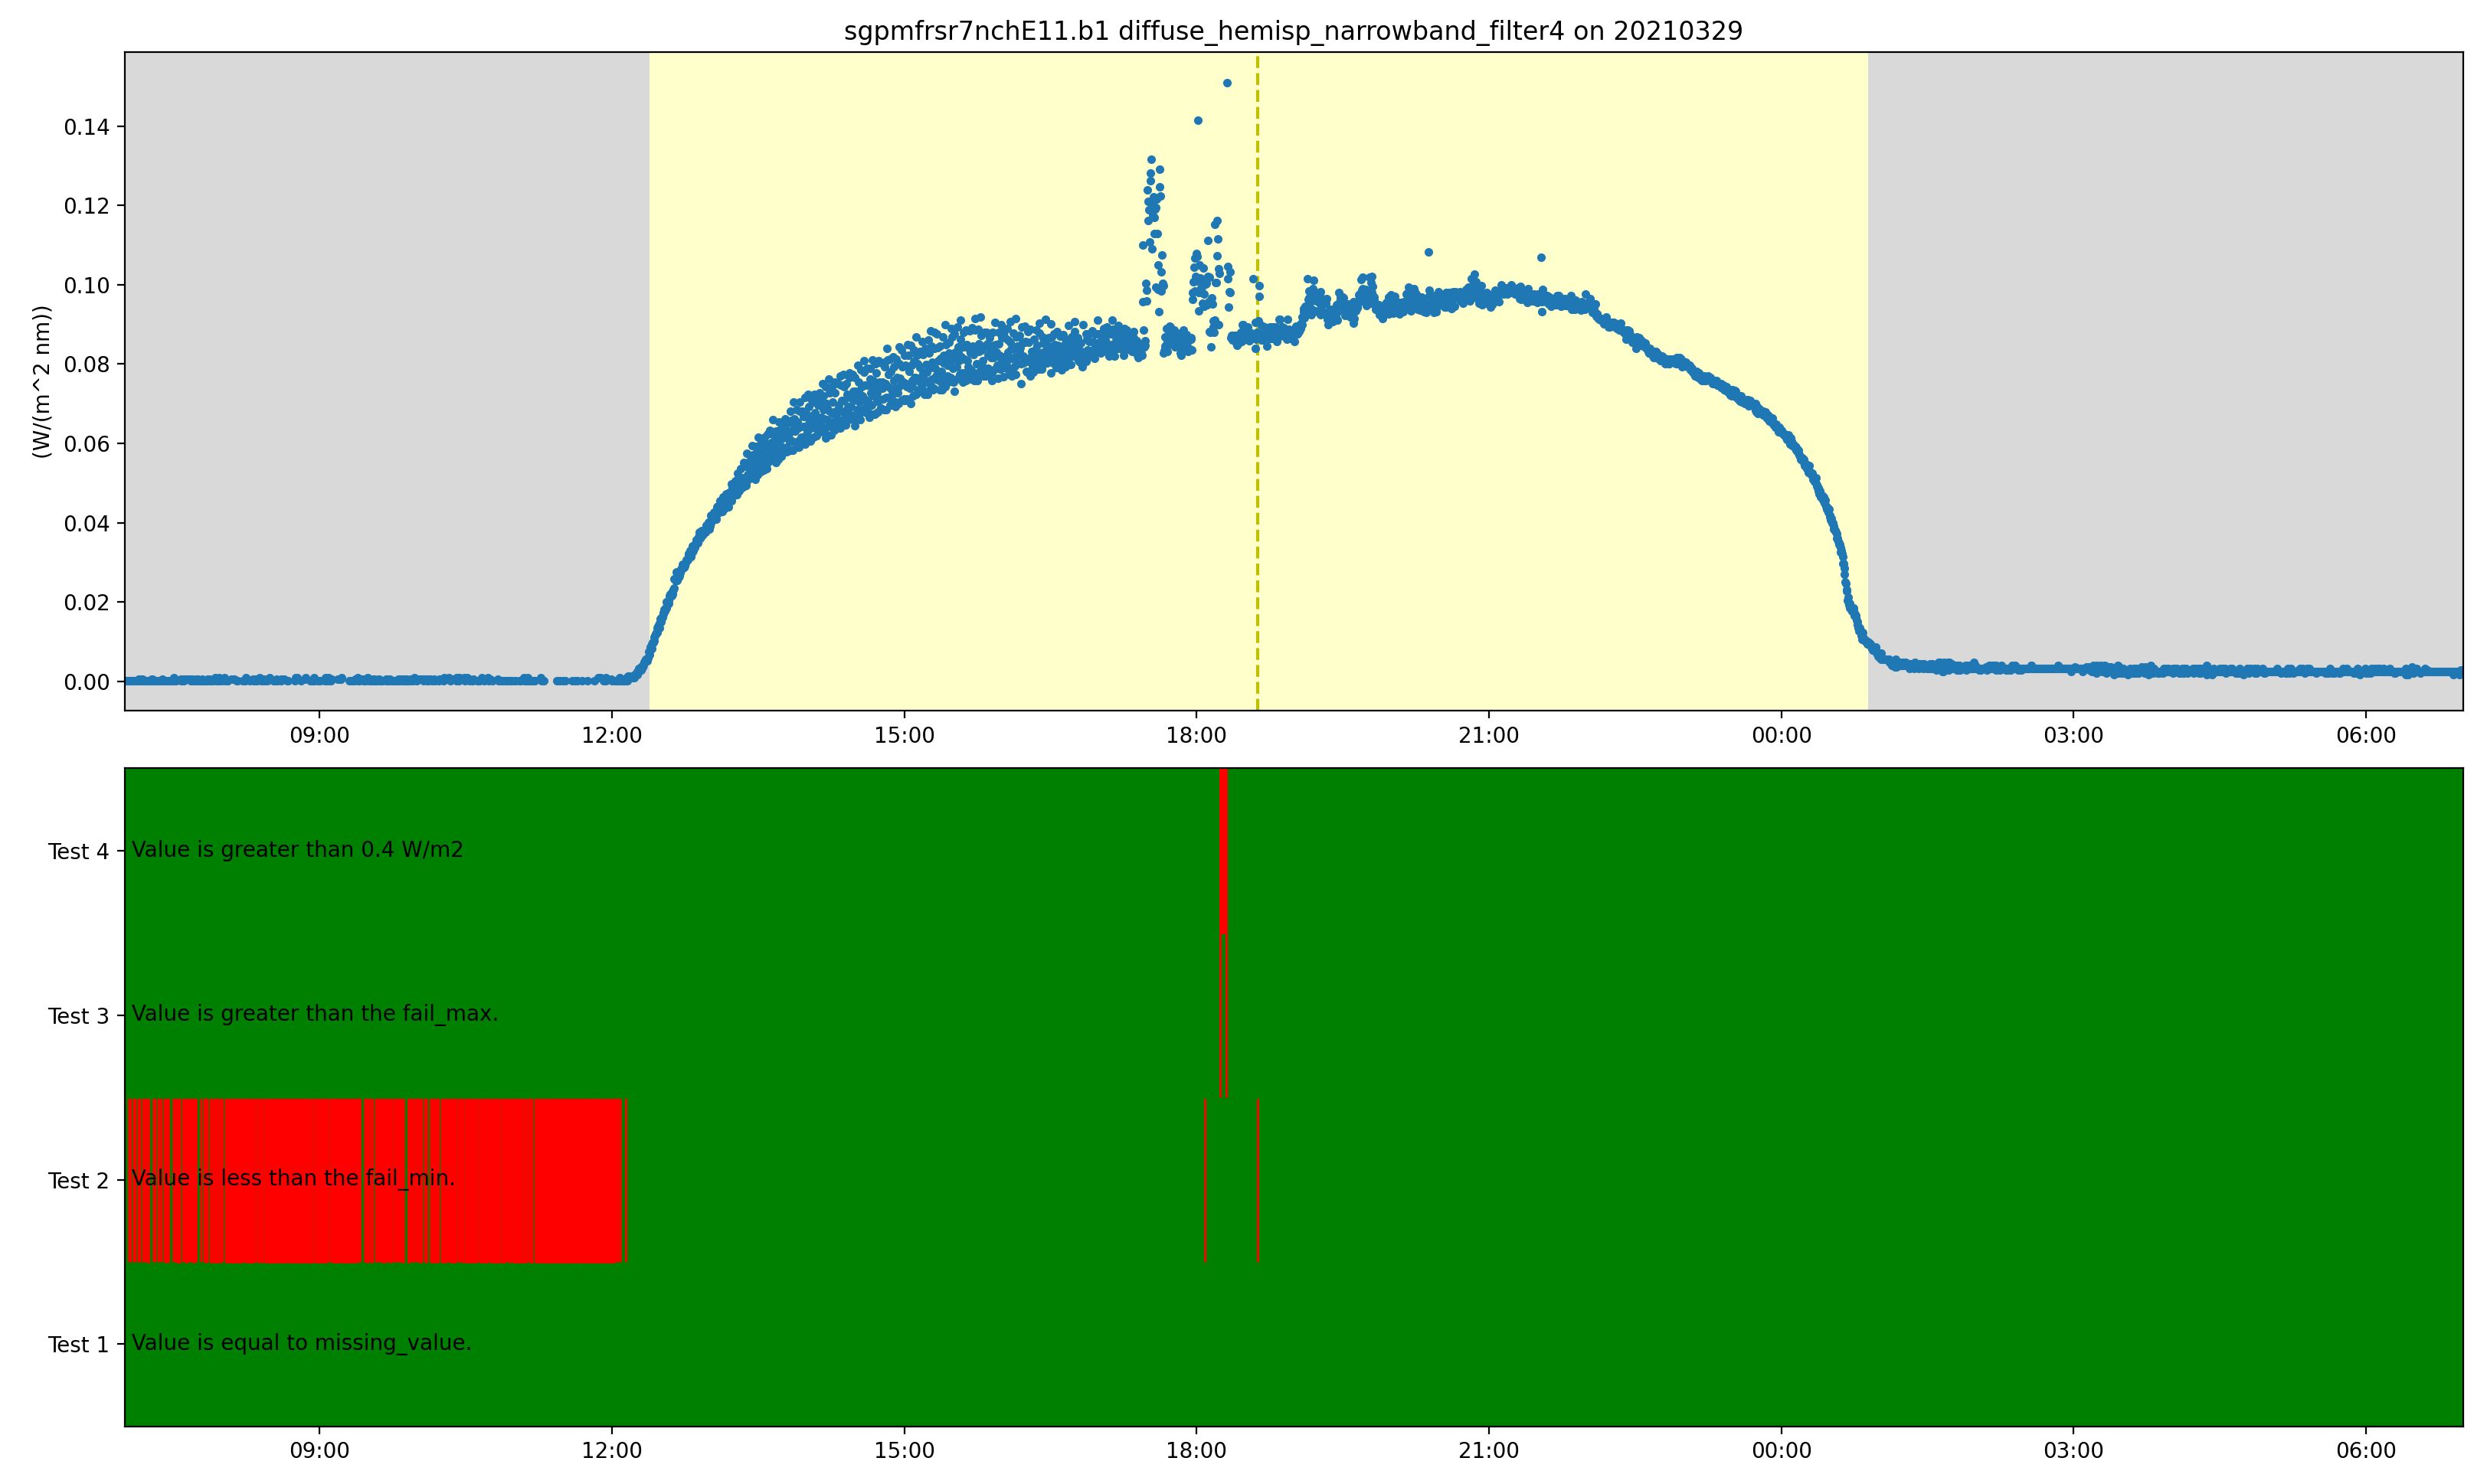
From this plot, we can see that some values are falling below the set valid minimum overnight (red shading on test 2 from 0700–1200 UTC), which is somewhat expected with this instrument. But it is also happening during the day along with some points failing the valid maximum (red lines around solar noon in the test 2 and test 3 QC block plot). Removing data that failed the valid minimum and maximum tests does help, but there still are some abnormal values. I can easily apply a stricter maximum limit of 0.4 W/m2, and we can get a nice view of the usual irradiance profile (third plot).
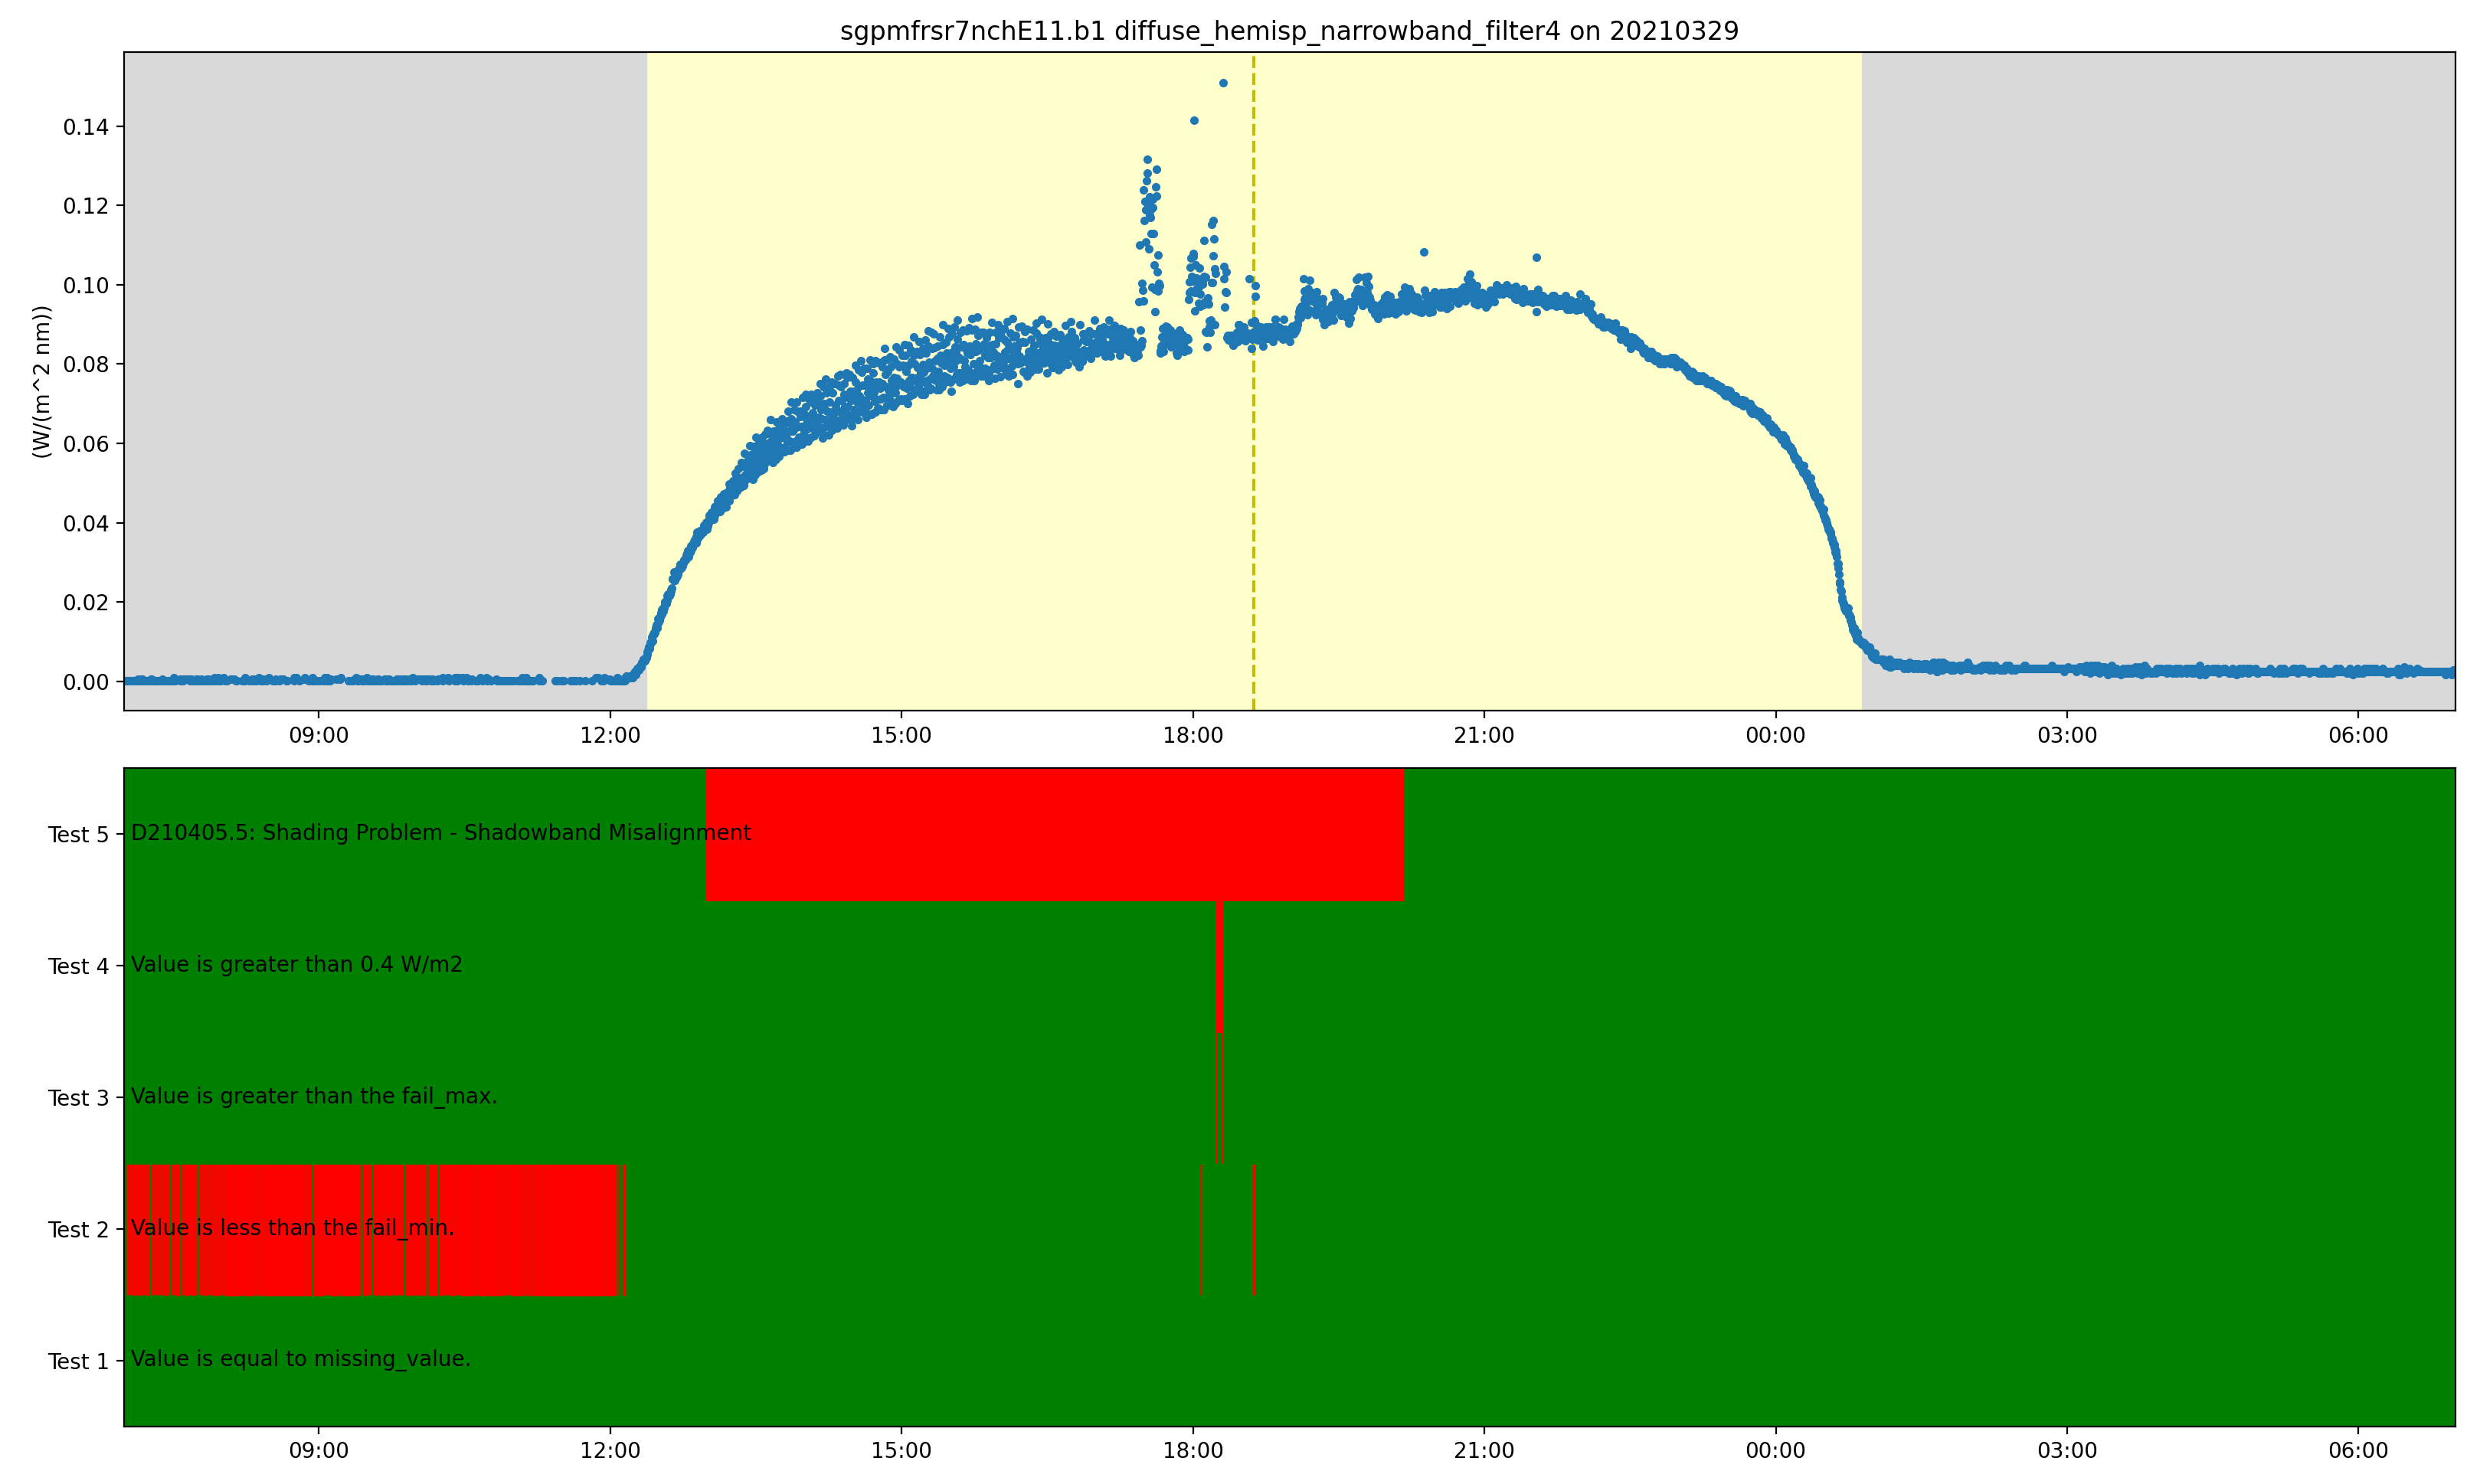
In looking at the data in the morning and early afternoon (roughly 1200–1800 UTC), something strange still seems to be going on, with the oscillations in the measurement. Let’s check the ARM DQRs for this instrument using ACT’s built-in function for interacting with the DQR web service. In doing so, we can see a period of data flagged for a shadowband misalignment, which shows up as the red block on test 5 in the QC block plot (fourth plot). Similar to how we excluded the minimum and maximum tests, we can exclude data flagged by DQRs.
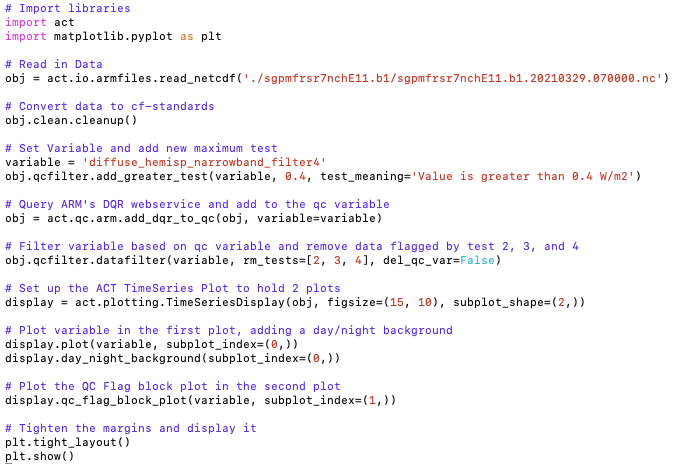
The code at the end (shown to the right, underneath the purple comments) is only 14 lines of Python code, excluding the comments and blank lines. It shows how tools like ACT can help make data exploration easier, especially when it comes to ARM’s QC information.
ACT has a lot of other features that we welcome you to check out and that we will blog about in the future. As always, we are happy to help users spin up on using it and welcome any contributions back to it! Please visit our ACT repository on GitHub.
Acknowledgments: The author would like to thank ARM Data Quality Office Associate Manager Kenneth Kehoe for his contributions to the ACT repository. Kehoe, who is based at the Cooperative Institute for Mesoscale Meteorological Studies at the University of Oklahoma, wrote the cleanup code and QC display code referenced in this post.
Follow Us:


Keep up with the Atmospheric Observer
Updates on ARM news, events, and opportunities delivered to your inbox
ARM User Profile
ARM welcomes users from all institutions and nations. A free ARM user account is needed to access ARM data.


