

ACE-ENA Spotlight: Capturing the 4-Dimensional Variability of Shallow Precipitation
Published: 21 September 2020
Editor’s note: This is the third entry in a blog series about ARM’s Aerosol and Cloud Experiments in the Eastern North Atlantic (ACE-ENA) field campaign, which took place during 2017 and 2018. Pavlos Kollias, an ACE-ENA co-investigator from Stony Brook University, shares a new set of precipitation findings from the air- and ground-based campaign.
The frequent occurrence of light rain in marine low clouds can have important impacts on cloud dynamics and structure and is a first-order influence upon the removal of aerosols from the marine boundary layer (MBL). Much of our understanding of the importance of drizzle on the MBL structure, including its depth, amount of turbulence, and decoupling state, has been gained through process modeling.
ARM established the Eastern North Atlantic (ENA) atmospheric observatory in 2013 to address the need for long-term, routine, high-resolution observations from an oceanic location. ENA data help researchers evaluate high-resolution, cloud-scale modeling and improve our observations-based understanding regarding the role of drizzle. The ENA observatory hosts an extensive suite of instruments, including three second-generation radar systems (Lamer et al. 2019). These unique measurement capabilities were further enhanced during the ACE-ENA field campaign by the operations of the ARM Aerial Facility Gulfstream-159 (G-1) aircraft, which provided in situ characterizations of MBL structure and aerosol, cloud, and precipitation properties.
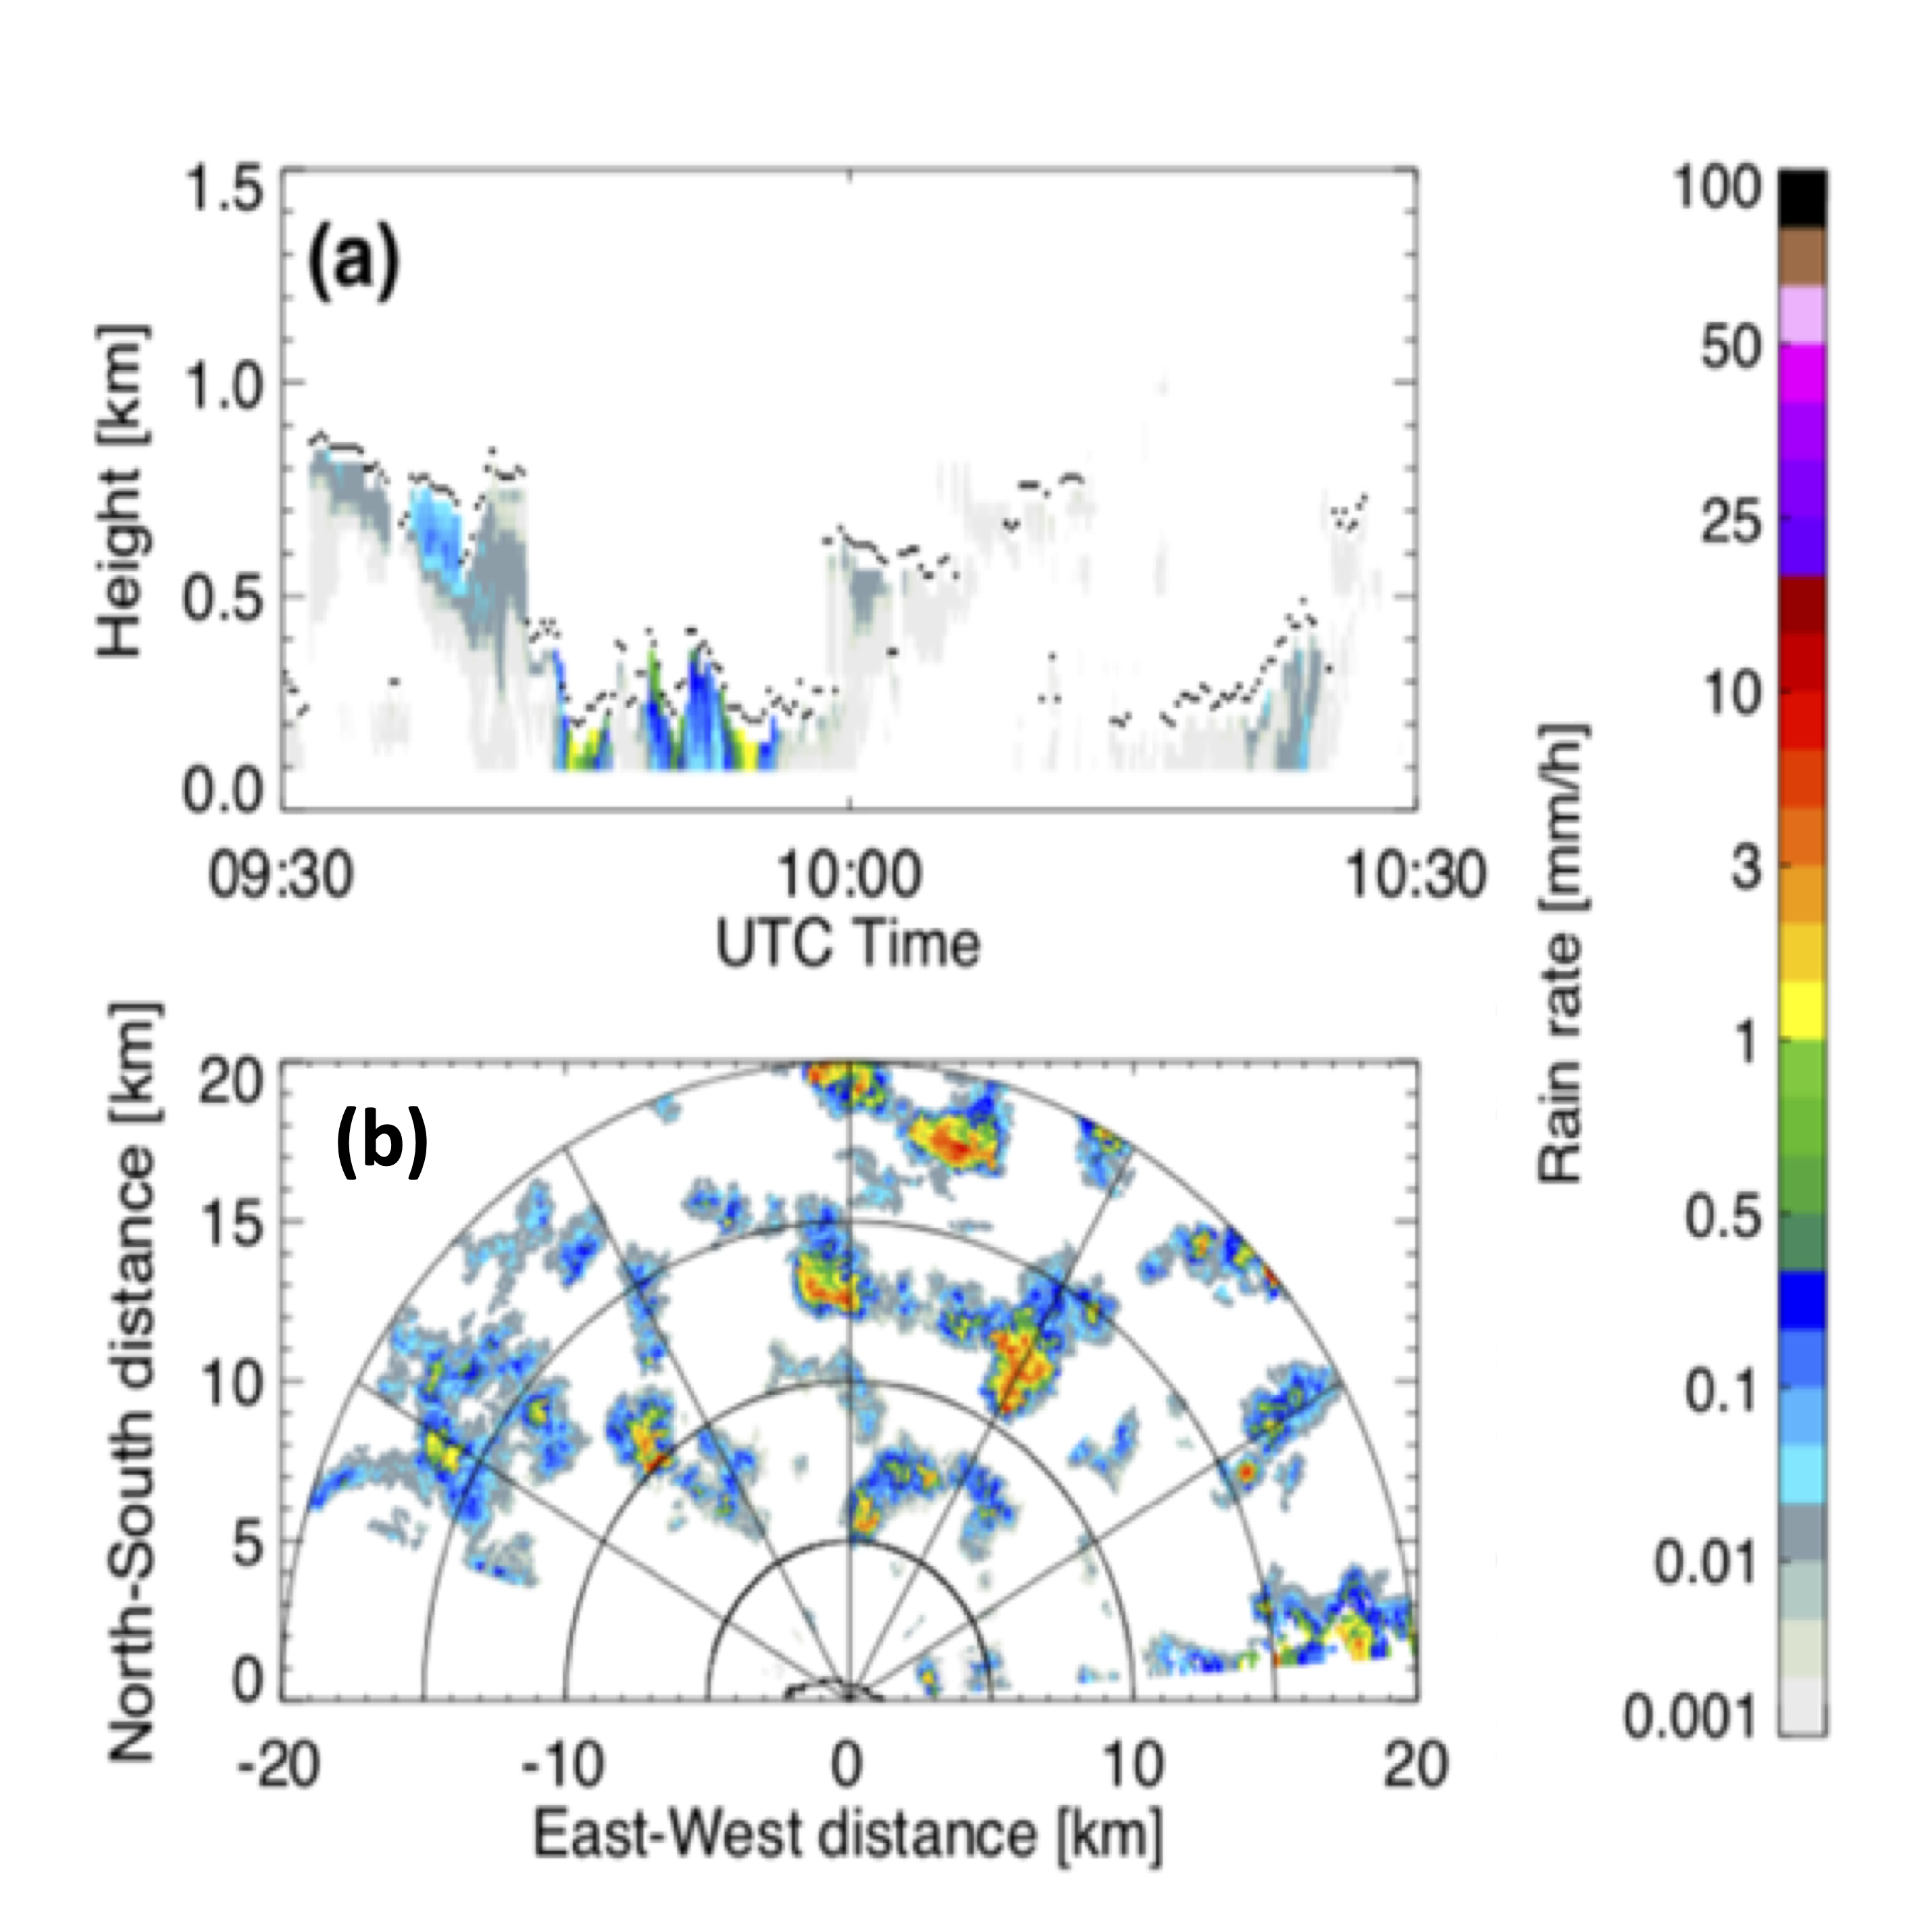
The combination of the profiling and scanning sensors at the ENA observatory enables us to connect the vertical structure of MBL clouds and associated precipitation—captured by the ARM profiling sensors (Figure 1a)—with the spatial organization of clouds and precipitation over a larger domain (40 kilometers by 40 kilometers, Figure 1b). Figure 1a—from February 2, 2018, which fell during the second intensive operational period of ACE-ENA—shows the time-height maps of rain rate from 200 meters above ground level to 90 meters below cloud-base height. Strong vertical gradients of the light precipitation below the cloud base were observed. A significant fraction of the precipitation was in the form of virga, and the highest rain rates were observed near cloud-base height. This variability was attributed to the evaporation process.
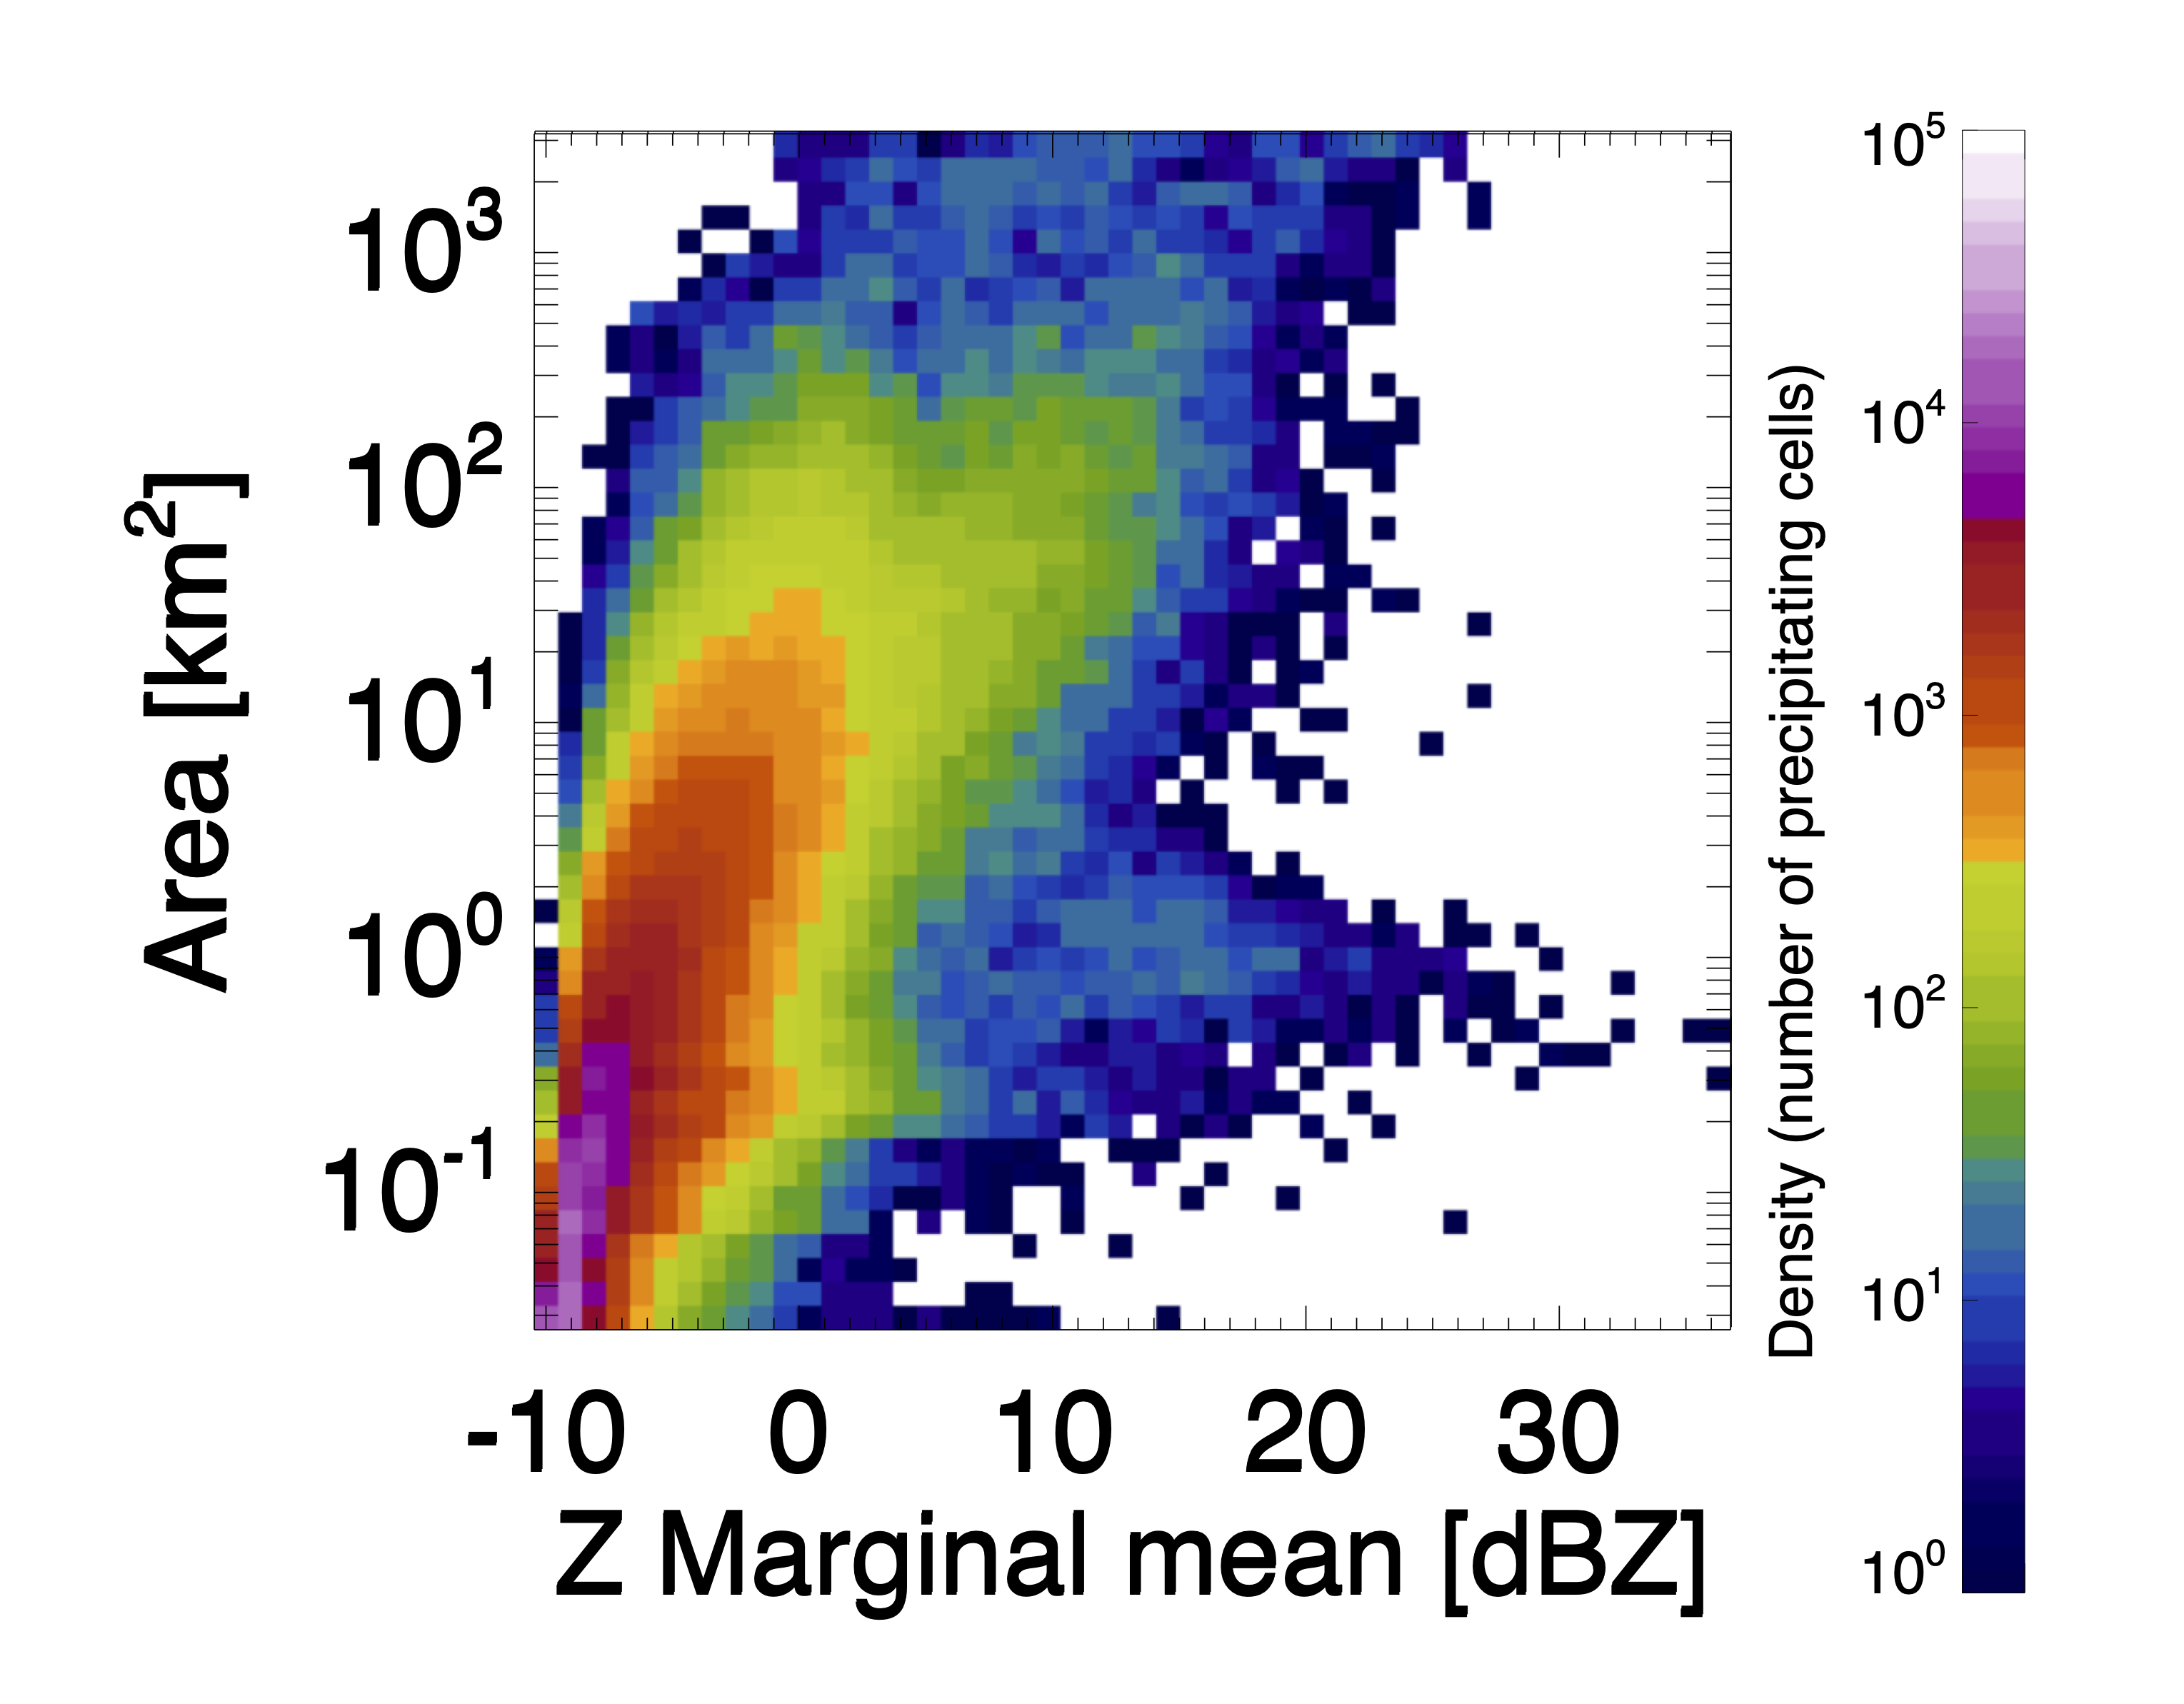
The long record of such routine measurements at the ENA is used to evaluate drizzle and evaporation schemes in numerical models. A different perspective of the shallow precipitation is provided by the X-Band Scanning ARM Precipitation Radar, which can observe the structure and scales of popcorn precipitation and squall-line precipitation over a domain of roughly 2,200 km2 (Figure 1b). Such measurements are available every five minutes and can be used to study the spatiotemporal mesoscale variability of light precipitation. In addition, such measurements can be used to study the properties of precipitating cells. Figure 2 indicates that most of the precipitation cells from January 15 to February 25, 2018, were smaller than 10 km2 and had average radar reflectivity below 0 dBZ, making their detection from spaceborne radars challenging.
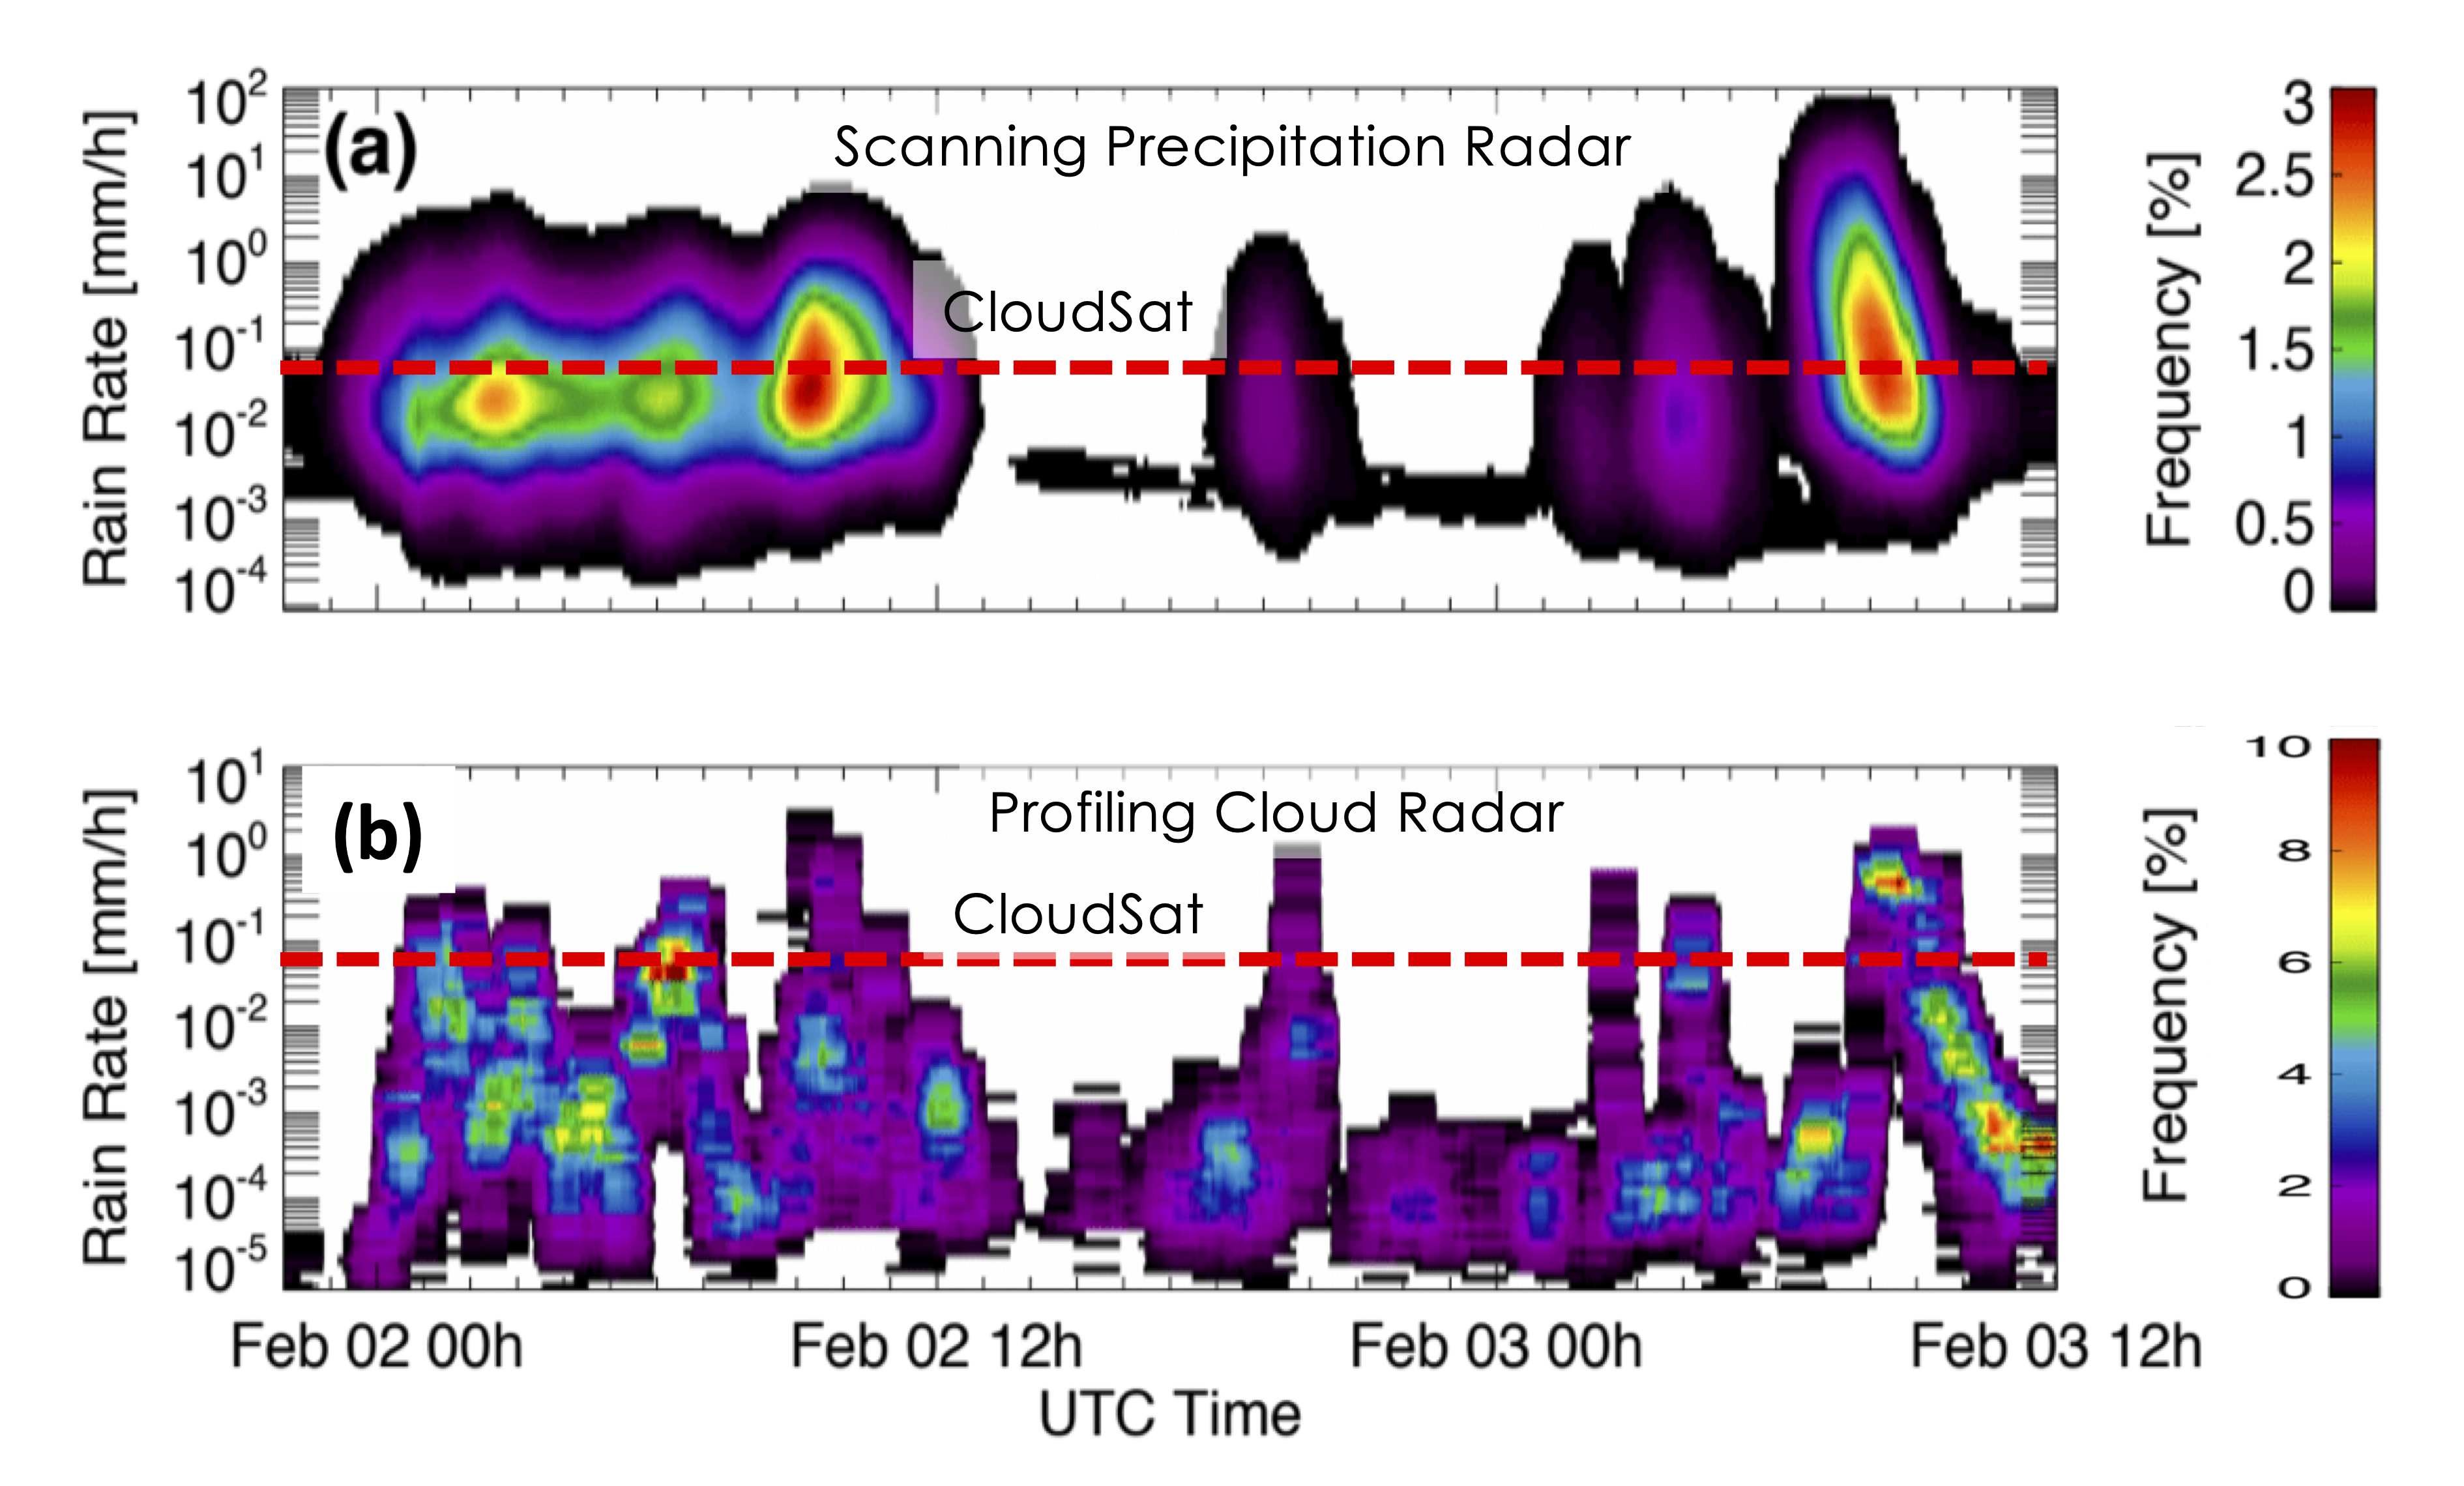
Figure 3 offers a different path to compare the different perspectives of shallow precipitation as depicted by the profiling and scanning sensors. The two panels show the hourly distribution of observed precipitation rates as a function of time from the scanning precipitation radar (Figure 3a) and the profiling cloud radar (Figure 3b). Due to its large sampling area, the scanning radar provides smoother hourly rain distributions. On the contrary, the profiling radar is capable of sampling only the cells that pass over the ENA. The profiling radar detects substantially lower rainfall rates that the scanning radar. Moreover, both ENA radars detect substantially more precipitation occurrences than NASA’s CloudSat Cloud Profiling Radar, which is considered the reference for mapping light precipitation over the oceans.
Our next step is to consolidate these different views of shallow warm precipitation and use them to evaluate the representation of warm precipitation in global circulation models.
Reference: Lamer K, B Puigdomènech Treserras, Z Zhu, B Isom, N Bharadwaj, and P Kollias. 2019. “Characterization of Shallow Oceanic Precipitation Using Profiling and Scanning Radar Observations at the Eastern North Atlantic ARM Observatory.” Atmospheric Measurement Techniques, 12(9): 4931–4947, https://doi.org/10.5194/amt-12-4931-2019.
Read previous ACE-ENA blogs from principal investigator Jian Wang and co-investigator Rob Wood.
To access ACE-ENA data, log in to the ARM Data Center. (Go here to create an account to download the data.)
Follow Us:


Keep up with the Atmospheric Observer
Updates on ARM news, events, and opportunities delivered to your inbox
ARM User Profile
ARM welcomes users from all institutions and nations. A free ARM user account is needed to access ARM data.


